Have interest rates gone up enough? Odds are high, this question is on the minds of global investors.
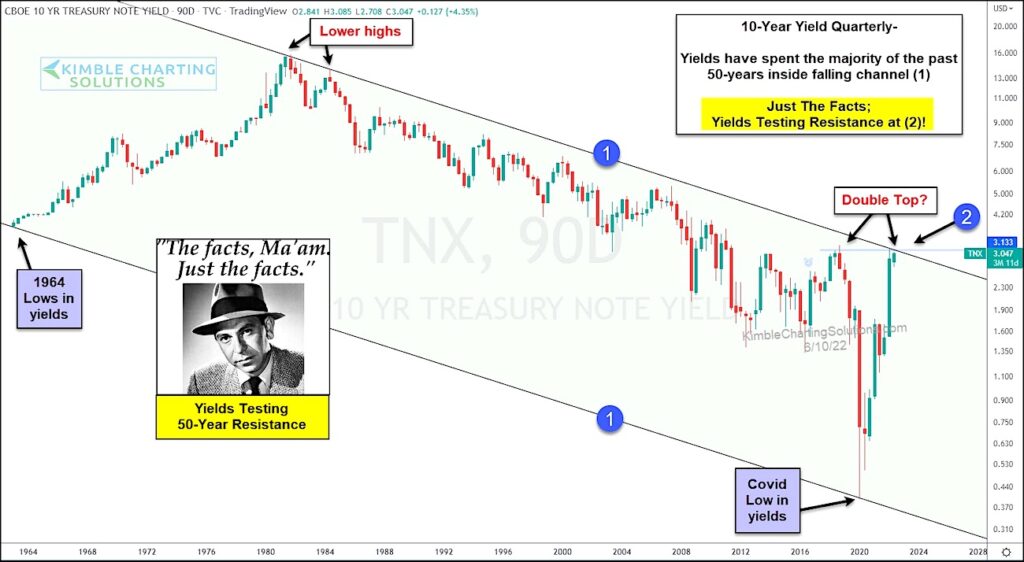
This chart looks at the 10-year treasury bond yield, on a quarterly basis, since 1963.
For more than 50-years, yields have created lower highs and lower lows inside of falling channel (1).
The rally in bond yields over the past two years has yields testing 2018 highs and the top of the channel at (2).
Joe Friday Just The Facts Ma’am: The 50-year channel resistance is in play. If interest rates break out at (2), odds increase stocks will be concerned with it!
$TNX 10-Year Treasury Bond Yield “quarterly” Chart
Note that KimbleCharting is offering a 2 week Free trial to See It Market readers. Just send me an email to services@kimblechartingsolutions.com for details to get set up.
Twitter: @KimbleCharting
Any opinions expressed herein are solely those of the author, and do not in any way represent the views or opinions of any other person or entity.

 Flirting With Critical Support… Again")


