Retail stocks as a group are just about flat on the year, but three charts suggest things may only get worse for this sector.
Today I’ll go through the weekly and daily charts for the Retail Sector ETF (XRT), as well as gauge its relative market strength in a final chart. Let’s get started.
The weekly chart of XRT dating back to late 2009 provides us with a structural picture of this sector and how retail stocks have fared in general. Prices remained in an uptrend for six years off of the 2009 lows, but momentum diverged negatively each time prices made a new high. In late 2015, prices finally confirmed those negative divergences by breaking down below the uptrend line from the August 2009 lows and former support near 44.
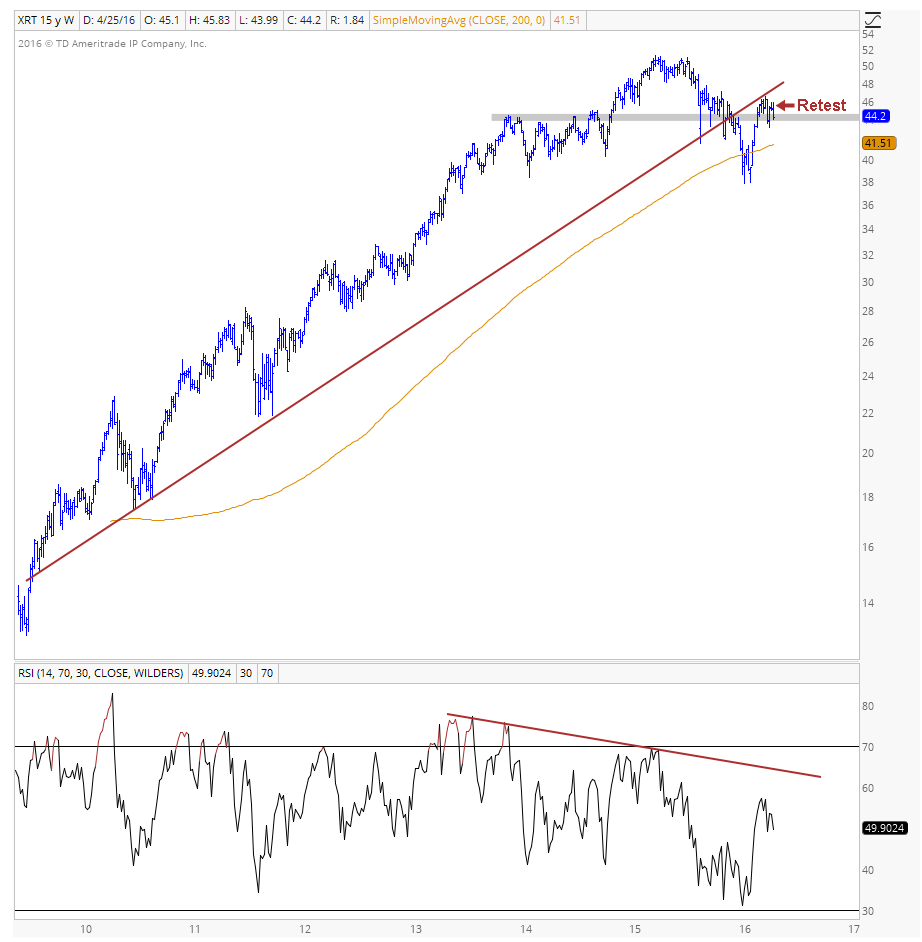
Prices are now retesting this breakdown level and appear to be rolling over once again. As long as prices remain below the uptrend line from the August 2009 lows a neutral/bearish bias toward this sector is best. If prices can make new weekly closing lows below 43, I think the selling of retail stocks will really start to accelerate and could be more aggressive on the short side with XRT. Potential price targets for this decline, if it develops, include the YTD lows of 37.80 and a prior breakout area near 32.
The daily chart of the retail sector (XRT) provides a more tactical view of this sector’s recent struggles. After an aggressive rally off the February lows, price put in a failed breakout above the 61.8% retracement of the July-February decline and confirmed the bearish divergence in momentum. Prices have not been able to close above that level in the weeks since and are now rolling over. Not a good sign for retail stocks.
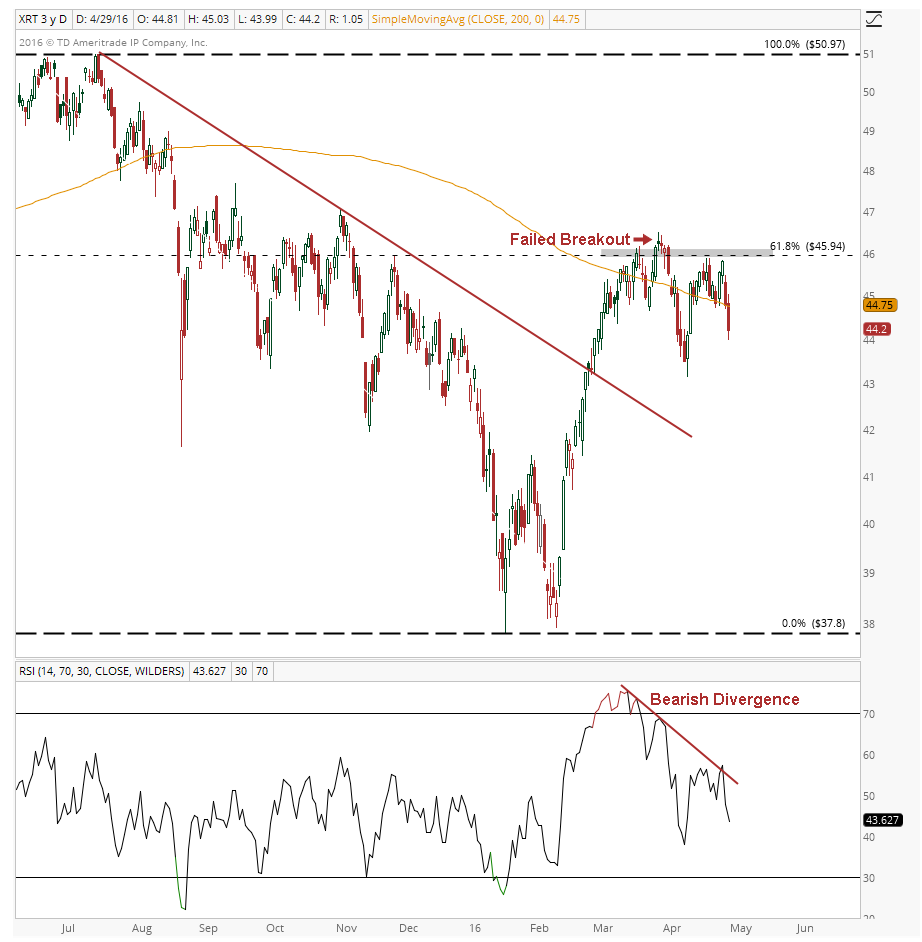
This weak price action, combined with the presence of a downward sloping 200 day moving average suggest a neutral/bearish bias is appropriate in this sector as long as it remains below 46 on a daily closing basis. If prices remain below that level, they remain vulnerable and may test the February lows, which would correspond with our first structural downside target.
In addition to the sector’s headwinds on an absolute basis, it continues to struggle relative to the S&P 500 as well.
The daily chart of XRT / SPX represents this relationship.
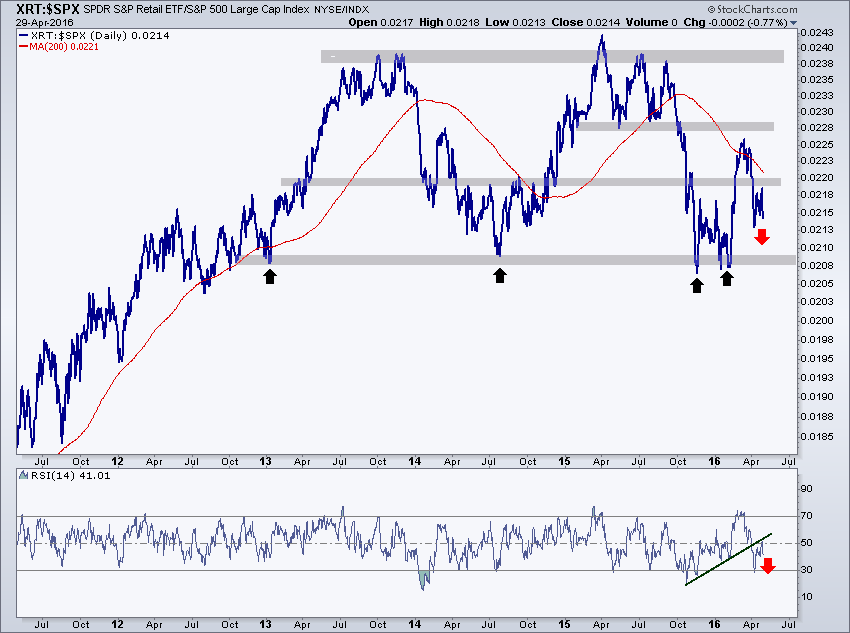
This ratio has been rangebound for roughly 3.5 years now, but recently failed to get back toward the top of the range and is close to testing its lower bounds for a 5th time. With momentum in a bearish range and prices below a downward sloping 200 day, a neutral/bearish bias is most appropriate. The more times prices test this long-term support level near 0.0208, the more likely it is to break through and continue to the downside. If that happens we’d want to evaluate the market conditions at that time and assess whether getting short this ratio is appropriate. For the time being however, this relationship simply serves to illustrate the recent and long-term under-performance of the Retail Sector ETF (XRT) relative to the S&P 500.
Sector Breadth: Lastly, I think it’s worth noting that while the index itself is only 13% off of its 52-week high, the average component within the index is roughly 25% off of its 52-week high. This deterioration in breadth and narrowing of leadership in retail stocks could make it difficult for the index to hold its ground if its current leaders take a pause or succumb to this weakness themselves.
The Bottom Line: The current weight of evidence suggests a neutral/bearish bias in the Retail sector is appropriate. Prices currently look vulnerable on both a structural and tactical basis, and weak breadth could exacerbate any potential declines in the sector ETF.
A continued correction through time would be constructive for the retail sector on an absolute and relative basis as it would allow it to deal with its overhead supply and other issues mentioned above in a healthy way. I think that’s the lower probability outcome, but I’m remaining open-minded and would adopt a more neutral stance on retail stocks if prices get back above the former support levels outlined above.
Structurally I would only want to be short this market if prices are below the uptrend line from the August 2009 lows on a weekly closing basis and would be getting more aggressive on the short side with a weekly close below 43. Structural downside targets for this market are 37.80 and 32.
Tactically I would only want to be short this market if prices are below 46 on a daily closing basis and would be taking profits near 41.50 and the YTD lows of 37.80.
There’s no reason to be long or short the ratio of XRT / SPX as it’s in no-man’s land currently, and was simply used to illustrate the fact that the retail sector is in a long-term downtrend relative to the S&P 500. Short positions could be considered if it closed below long-term support at 0.0208, but would have to be assessed based on the market conditions at that time.
Thanks for reading and, as always, if you have any questions feel free to reach out or comment here and I’ll get back to you as soon as I can.
More from Tom: Apple Stock Weakness Means It’s Time To Be Cautious
Twitter: @BruniCharting
The author does not have a position in any of mentioned securities at the time of publication. Any opinions expressed herein are solely those of the author, and do not in any way represent the views or opinions of any other person or entity.


: Showing Some Signs of Emerging Strength")
