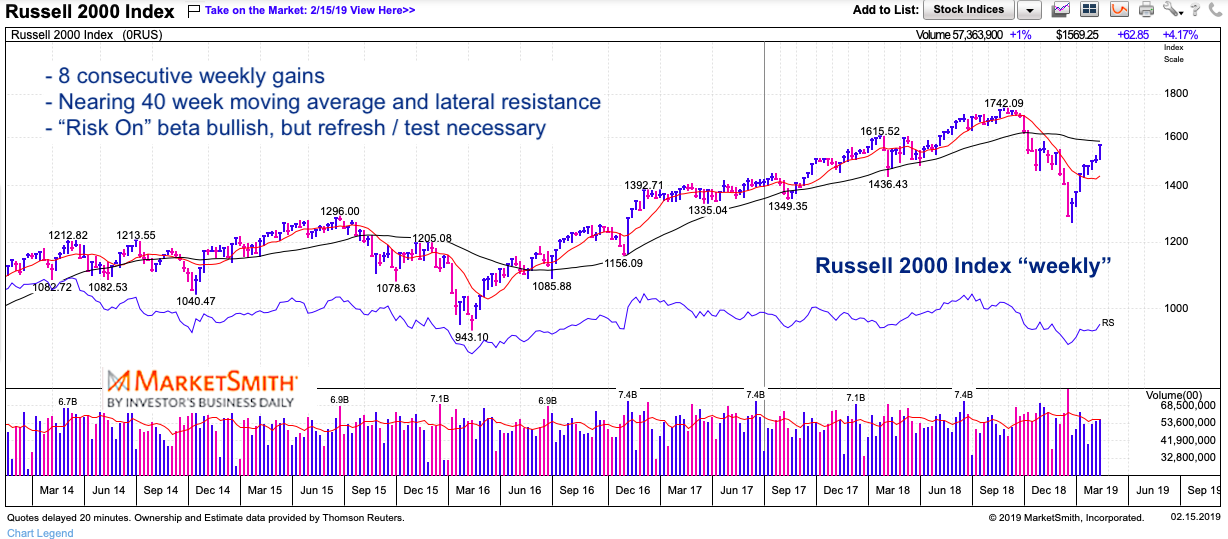
The Russell 2000 Index (INDEXRUSSELL: RUT) has recorded 8 consecutive “green” weekly candlesticks (all producing weekly gains vs week ago).
If you are a bull, this is what you want to see.
Small cap stocks represent more than just the domestic economy and market… they also represent high beta (or “risk on”) for investors.
In today’s market note, I’ll take a look at the daily and weekly charts for the Russell 2000 Index and highlight why we’re likely to see a multi-week pause before new highs.
Note that the following MarketSmith charts are built with Investors Business Daily’s product suite.
I am an Investors Business Daily (IBD) partner and promote the use of their products. The entire platform offers a good mix of technical and fundamental data and education.
Russell 2000 Weekly Chart
Here you can see those bullish candlesticks. Looking at the chart, you can see that this is the first time with 8 consecutive weekly closes with gains in the past 5 years.
The small cap index is red hot, but it has yet to close above its 40 week moving average. All of the other major stock market indices (S&P 500, Nasdaq, Dow Industrials) have accomplished this. So while the move is bullish, it’s likely time to start watching for signs of slowing momentum (as that may give way to a reversal and pullback).
Waiting for a retracement lower makes sense for “new” buyers, in my opinion. And that retracement could take up 1/3 to 1/2 the time of the rally (IF bullish). For example: If the rally ends this week, we could retrace into mid March.
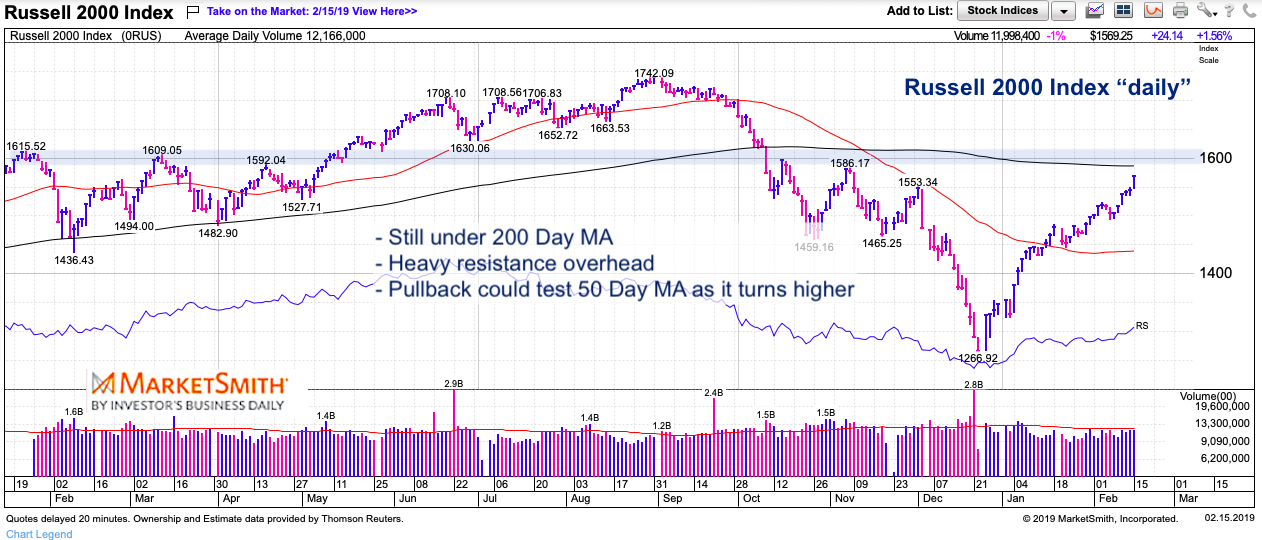
Russell 2000 Daily Chart
On the daily chart, we see a similar theme. Red hot, but the Russell has yet to close above its 200 day moving average. As we move closer to this feat, we are likely moving closer to the inevitable pullback.
Lateral resistance comes in between 1585 and 1610. We could touch that zone this week and begin a pullback.
Twitter: @andrewnyquist
The author does not have a position in mentioned securities at the time of publication. Any opinions expressed herein are solely those of the author, and do not in any way represent the views or opinions of any other person or entity.

 Testing Important Price Support")
: Cup (and Maybe Handle) Watch")

