From Memorial Day on, the financial media tends to talk about the “summer driving season” and how an increase in automobile use should benefit gas prices (RBOB) going forward. While this may seem logical, the data actually suggests this period of the year is when gas prices tend to peak after strong performance throughout February-May. Could this spell the end of the current RBOB rally?
This year Gasoline prices certainly lived up to their seasonal tendencies by rallying roughly 85% off their YTD lows, but recent price action and momentum may be suggesting the RBOB rally is setting up for a correction, either through time or price.
Looking at the daily chart below we can see the gap and go to the upside that occurred in late February / early March. Prices have since traded higher within an uptrend channel, but momentum has failed to confirm this rally by making new highs with price.
RBOB Spot Gasoline Prices – Daily Chart
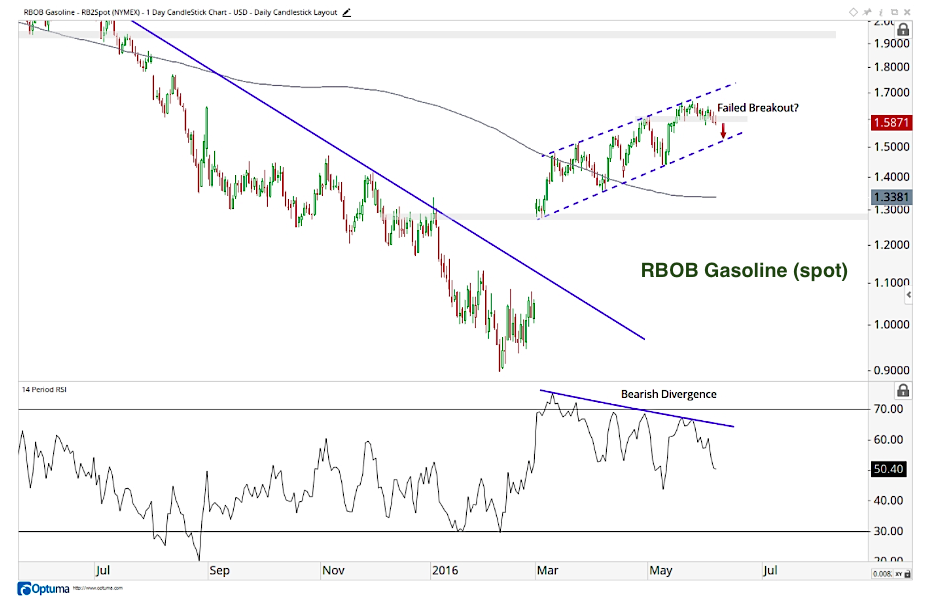
On May 16th prices broke above the April highs, but their multi-week consolidation is now resolving to the downside. This confirms a failed breakout and the bearish momentum divergence that has been building over the past several months. These conditions, combined with a flat 200 day moving average, suggest a sustainable RBOB rally will be difficult to stage without further consolidation first.
As long as prices are below the April highs on a daily closing basis, a neutral / bearish bias remains appropriate in this market. My initial price target if prices break the uptrend line from the March lows is near 1.37. This is based off of former support at the April lows and the 38.2% Fibonacci retracement of the YTD rally. My secondary price target is at the March lows of 1.28.
The Bottom Line: The recent breakdown below the April highs in Gasoline prices confirmed a failed breakout that could put pressure on prices as they enter a seasonally weak period. As long as prices are below the April highs, a neutral / bearish bias is appropriate as a correction toward 1,37 and 1.28 looks possible. A positive development for this market would be a continued correction through time to allow the 200 day moving average to begin rising and for momentum to work off this divergence in a healthy way. I think this is the lower probability outcome, but will remain open minded and adjust my thesis as the weight of the evidence changes.
As always, if you have any questions feel free to reach out and I’ll get back to you as soon as I can.


