The breakdown and increased volatility in crude oil prices since last summer have made forecasting difficult for industry analysts who must follow the intricate factors affecting supply and demand. On the other hand, volatility has made the technical analyst’s job easier. Here we show why we believe the United States Oil Fund ETF (USO) – the premier ETF that tracks crude oil prices – is destined to trade lower into next year.
We aren’t suggesting that traders should ignore fundamentals. Some trends and developments in the industry are fairly predictable in their effect on prices. At present, we believe there are several aspects of production and demand that should continue to hold prices down:
- China, which has been the world’s largest importer of crude oil this spring, may be entering a period of slower economic growth that could begin to reduce its consumption of petroleum and other natural resources in future months.
- China also has used recent low crude prices as an opportunity to add to its strategic petroleum reserves, but it probably will cease to be a customer during price upswings. There also are near-term limitations on its storage capacity.
- Developments in oil extraction technology continue to propagate through the global industry, leading to a larger number of wells and production operations that can be switched on in response to relatively small increases in price.
- There are signs of a global economic slowdown and a pending correction in stock markets. These come along with increasing deflation for the U.S. Dollar that serves as the denominator for USO and oil prices.
We are mindful that unpredictable geopolitical disruptions can still cause oil prices to spike. Even so, we believe it is easier to find the trades in this market by using charts and indicators than by reading news reports.
The big crash in oil prices during 2008 left some clues on oil charts that remain useful even six years later. In particular, the quick decline did not have the characteristics of a completed correction. During that year, we did not see the kind of wave structure that reflects market participants “arguing” over where price should be.
The lengthy consolidation in prices from 2009 to 2914 also did not have the appearance of a movement out of a correction. From an Elliott wave perspective, it looked like the middle phase of a larger correction. Thus we have labeled the big decline and the lengthy consolidation as waves A and B of what should become a three-wave correction.
The breakdown in prices last summer convinced us that the next downward leg of the correction – wave C — had begun. The monthly chart for USO shows how we believe price is progressing through a five-wave move down from the high in 2013.
United States Oil Fund ETF (USO) Monthly Chart
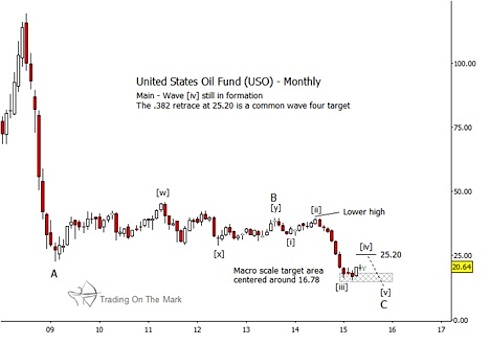
USO has bounced from a big-picture support area in what probably is a fourth wave. For that scenario to remain in favor, we would not want to see price go much beyond the 38.2% Fibonacci retracement level of wave [iii], or about $25.20. However, there are additional potential resistance targets calculated based on structures seen in a faster time frame.
United States Oil Fund ETF (USO) Weekly Chart
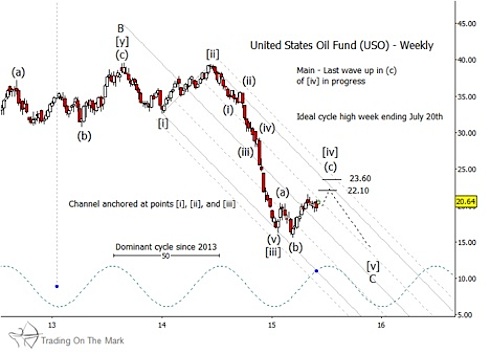
Since the 2013 high, USO has formed a nicely defined channel on a weekly chart. The center of the channel acted as resistance in April, and we would expect the upper edge of the channel to have an effect on price later this year at a level substantially below the 38.2% retracement mentioned earlier. In addition, Fibonacci extension measurements for the internal moves of wave [iv] put near-term targets at $22.10 and $23.60.
The next opportunity in trading oil markets probably will be downward. We expect price to reach for a lower low as it completes a five-wave pattern from the 2013 high. As always, we will keep subscribers up-to-date with revised price projections based on next developments.
We’d like to offer See It Market readers some exclusive charts and analysis that can help you catch the summer trades. Visit this page to take advantage of our free offer including select trading setups and analysis.
Twitter: @TradingOnMark
No position in any of the mentioned securities at the time of publication. Any opinions expressed herein are solely those of the author, and do not in any way represent the views or opinions of any other person or entity.


