Candlesticks are often a trader’s first exposure to technical analysis.
As a quantitative system developer for a high frequency and market making firm I can assure you that all the successful traders I have been lucky enough to meet have some type of system or at the very least know the general odds when placing their trades!
So today we’ll look at a way to define AND quantify candlesticks.
If we can do this, we can measure their usefulness as well as place smarter (more informed) trades.
Smarter trades should ultimately mean better returns! Some patterns might be more effective than others while some patterns might work great on some symbols but not on others. The only way to find out is to: define, quantify and test.
Let’s breakdown how to define and quantify 4 popular candlestick patterns.
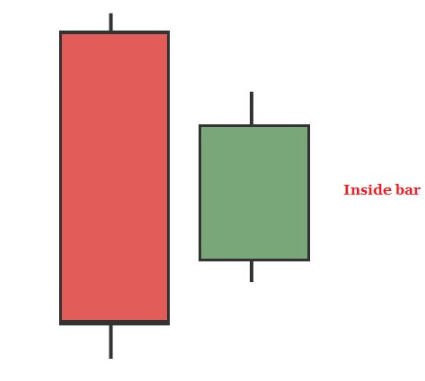
1. Inside Range or Inside Bar
Defined: A range that is contained within the previous bar’s range. Some require the direction of inside bar to be opposite of the preceding bar but I will not in this case.
Quantified: High[0] <= High[1] and Low[0] >= Low[1]
The high of the current bar denoted by [0] is less than or equal to the High of the previous bar denoted by [1]. The current low is also greater than or equal to the Low of 1 bar ago. We can then add another simple rule to check for positive or negative inside bars. Close[0] >= close[1] or Close[0] <= Close[1]
Quick Stat: In Gold futures, the day following a positive close inside bar has traded above the inside range’s high 72% of the time and only trades below the inside range’s low 44% of the time. The day following a negative close inside range trades above the inside range’s high 52% of the time and trades below the inside range’s low 49% of the time. Much more directional bias in the former.
2. Doji
Defined: An open and close that are very close together and an open and close near the middle of the bar to represent indecision.
Quantified: Absolute value (open – close) / range <= .10 and ibr >= .4 and ibr <= .6
This shows that the difference between the open and close, no matter which one is greater, is always less than or equal to 10% of the entire bar’s range. IBR is interbar rank or sometimes referred to as interbar strength. The value of IBR is what percentage of the bar’s range is below the close. So IBR > .4 and IBR < .6 means the bar’s close was in the middle 20% of the bar’s range. This combination of rules accurately defines a doji. Note: It ignores gravestone dojis or dragonfly dojis which can be accounted for by adjusting the IBR thresholds.
Quick Stat: In Gold Futures, the day following a ‘Doji’ as we have defined it here closes higher than the Doji’s close 62.6% of the time compared to closing lower only 37.9% of the time.
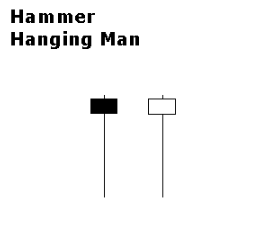
3. Hammer
Defined: A hammer is meant to show sellers taking control mid bar and then buyers regaining control and closing near the top of the bar leaving a long wick at the bottom of the candle.
Quantified: IBR > 90% and absolute value(open-close) / range <= 10%
Let’s assume the open or close must be within the top 10% of the bar’s range (ibr) and are contained within a 10% window of the bar’s range.
Quick Stat: In Gold Futures, the day following a Hammer (as defined above) only closes higher 46% of the time. Extremely small sample size due to our narrow definition.
Notes: We could do things like compare the height of the body to the lower wick or relax some of our rules above to find more ‘hammer’ occurrences. Additionally, some might only quantify a hammer based on relation to previous candles as well. Furthermore, looking more than 1 day ahead could also yield different results, too. Then of course adding other context like moving average comparison or other indicators, etc. can add/subtract value as well.
4. Bearish Kicker
Definition: This pattern shows a gap and go down bar after a strong up bar. This reversal pattern has candles in opposite directions.
Quantified: Close[1] > Open[1] and ibr[1] > .9 and High[0] < Low[1] and Close[0] < Open[0] and ibr[0] < .1
In the photo above you can see that the previous bar’s close was indeed above the previous bar’s open. It also closed in the top 90% of the bar’s range. The current bar’s high was below the previous bar’s low while closing negatively below the current bar’s open. The current bar also closed in the bottom 10% of the bar’s range.
Quick Stat: I will leave this one for you to research. I think this is a good starting point. Imagine if you had a tool to easily do this kind of thing!
A few future ideas:
Now that we can identify simple rules to define and test known patterns…. what if we combine ideas like these with MACD, RSI, Stochastics or other indicators to give more context? What happens to these patterns when we add a rule such as above or below the 50-period moving average?
Another question we can answer now is do our findings (statistics) show similarity on each stock and asset class? For example, the inside pattern works on Gold but not the same on others. It is important to check everything before investing hard earned money; few do this level of work and that is why very few win.
Imagine seeing a certain pattern work very well on stock #1. Then that recent success on stock #1 encourages you to take a similar set up on stock #2. This is a dangerous pitfall that those without the data make over and over again.
Yes, setting up all these tests and building a database of stats to use can be extremely difficult and time consuming. However, my goal with Build Alpha is to make it so simple that if you can click a mouse then you can run this type of research (and more).
For a simple example, just click on the “hammer” signal or create your own candlestick patterns with the built-in open, high, low, close rule library and then combine with the built-in technical indicators, etc.
Stop trading randomly or without knowing the odds.
To learn more about this type of research or Build Alpha please feel free to email me david@buildalpha.com.
Twitter: @DBurgh
No position in any of the mentioned securities at the time of publication. Any opinions expressed herein are solely those of the author, and do not in any way represent the views or opinions of any other person or entity.


