While the past two months saw a strong stock market rally unfold, the past few weeks have offered up evidence that the market could get choppy.
Market leaders, the Russell 2000 and Nasdaq have been hit hard of late, while the S&P 500 and Dow Jones Industrials continue to hover beneath their January highs.
Q3 Investing Outlook Highlights:
- Flattening Yield Curve Drawing Concerns
- GDP Growth Surges But Questions Remain
- Earnings Surge But Valuation Still Elevated
- Optimism On the Rebound
- Small-Caps Seeing Seasonal Weakness
- Broad Market Not Providing Confirmation
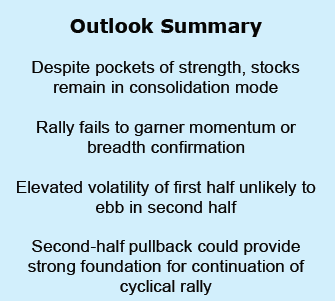
While stocks have started the second half of 2018 much as they began the first half of the year (in rally mode), the overall weight of the evidence argues for caution.
After testing support in late June, the S&P 500 has moved higher in July, reaching levels not seen since January. This move higher has not been accompanied by an improvement in the weight of the evidence, which continues to argue for caution.
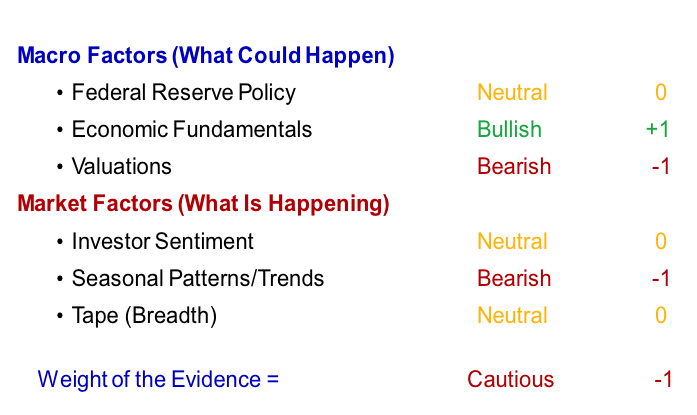
The macro backdrop has been stable in 2018. Bullish economic fundamentals have been offset by bearish valuations while Fed policy remains neutral as accommodative policies continue to be unwound. The market factors argue for caution right now. Sentiment and breadth remain neutral. Optimism has risen in surveys of investors, but fund flows show a shift away from equities. Breadth is a hotly debated topic right now as investors and pundits try to gauge the underlying strength in the stock market.
Our view has been and remains that while we are not seeing evidence of meaningful negative divergences in the breadth indicators, we are also not seeing sufficient strength to confirm the recent moves in the popular averages. From a seasonal perspective, stocks are entering a historically weak period ahead of the mid-term elections. After leading large-caps higher for much for the year, small-caps have stalled in July, which could be evidence that typical seasonal patterns are going to play out in 2018.
Ours is not a business of making forecasts but discerning risks. Right now the evidence suggests that risks are elevated and investors should consider taking a relatively cautious stance toward equities.
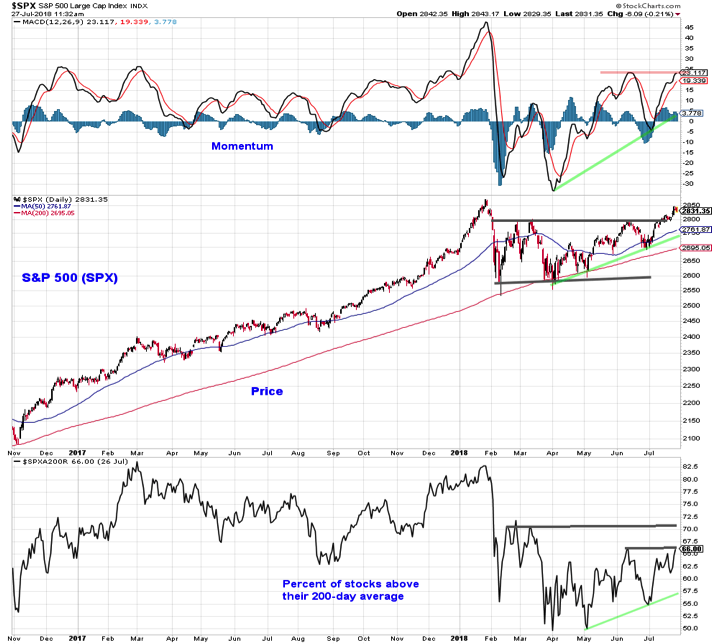
The late-June pullback on the S&P 500 found support as the index moved toward the rising trend line that emerged off of the April and May lows. The July rally has carried the index to its second-highest close on record but neither momentum nor breadth confirmed this strength. While the pattern of higher lows across these indicators (momentum, price and breadth) is encouraging, index-level rallies have failed to gather broad-based participation. The percentage of stocks trading above their 200-day average exceeded 80% in early 2018. It peaked just above 70% in February and March and has since struggled to exceed 67%.
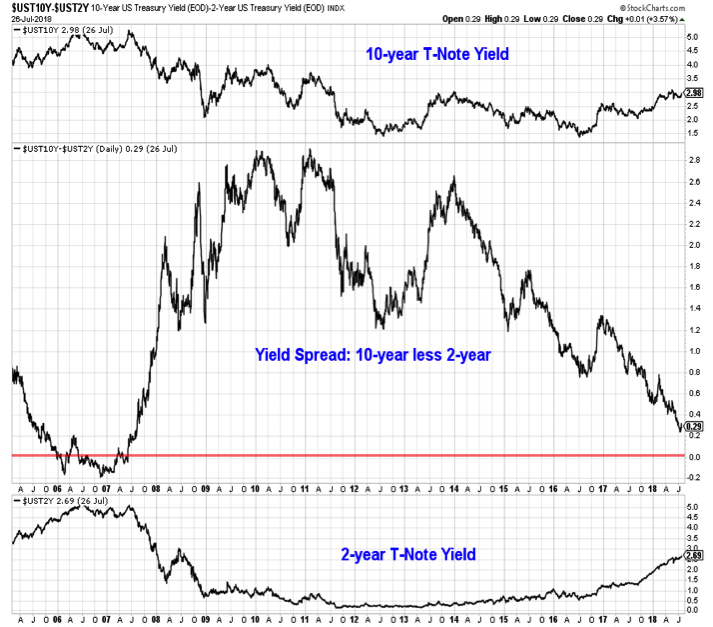
Federal Reserve Policy remains neutral.The Fed raised rates by 25 basis points in June and is expected to tighten again in September. Much of the recent focus concerning the Fed has been the yield spread between the 2-year T-Note (viewed as the most sensitive to Fed rate hikes) and the 10-year T-Note (which is more typically market-determined). Tightening by the Fed has pushed 2-year yields higher, while 10-year yields (for a variety of reasons) have moved higher at a slower pace. The decline in the yield spread has attracted attention because inversions in the spread (e.g., when 2-year yields have moved above 10-year yields) have been a reliable leading indicator of recessions in the past.
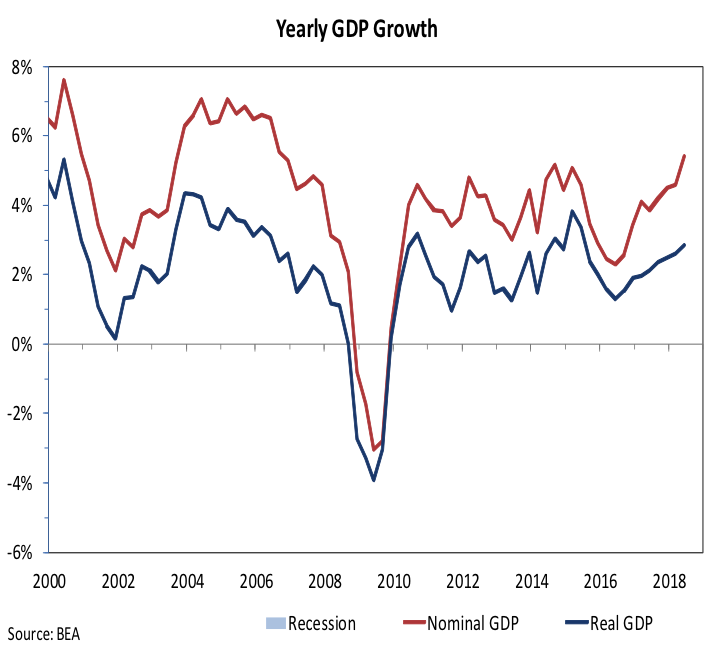
Economic Fundamentals remain Bullish.Beyond the potential inversion in the yield curve, there is not much that points to deteriorating economic conditions (though the recent moves on commodities are worth watching). Initial jobless claims remain low, the number of job openings has exceeded the total number of unemployed workers for the first time on record, and GDP growth is accelerating. The first look at GDP growth for the second quarter showed real growth of more than 4%, the best showing since 2014. Growth in real final sales of domestic product surged more the 5%, the best in over a decade. This continues the recent trend in accelerating yearly growth that has been seen on both a real and nominal basis.
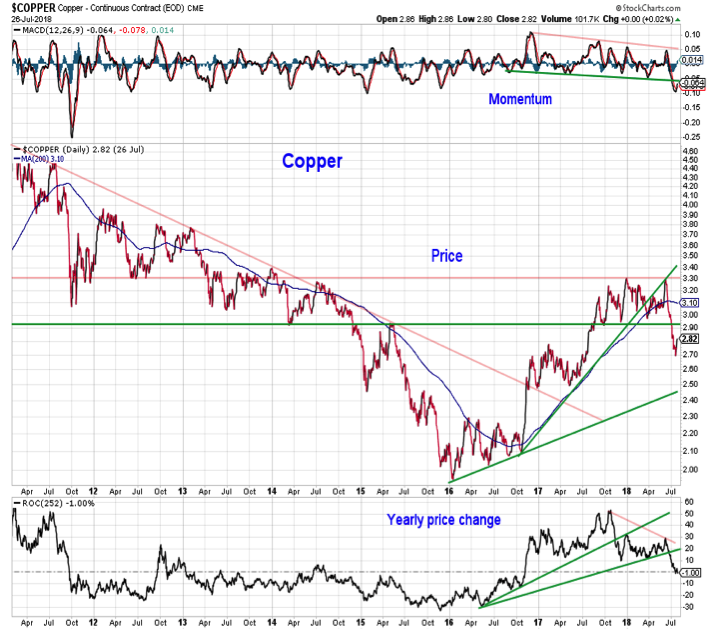
Commodity prices (especially copper) can be a timely market signal that economic conditions are deteriorating. The reversal in copper over the past two months bears watching. After a failed breakout, it broke below support and is now in negative territory on a yearly price change basis for the first time since 2016. A break below the up-trend that emerged in 2016 could signal meaningful deterioration in economic conditions in the U.S. and around the globe.
Valuations remain Bearish. Second-quarter earnings are being reported and companies are generally beating expectations on both the top line (sales) and the bottom line (earnings). With nearly 250 companies having reported earnings for the second quarter, 85% have beaten earnings expectations and 75% have exceeded sales expectations.
The surge in earnings over the first half of 2018 has helped price/earnings ratios retreat from their peak levels, but we have yet to see a sufficient combination of earnings improvement and/or price weakness to suggest valuations are no longer a headwind for stocks.
continue reading on the next page…


