With nearly all of the S&P 500 companies having reported Q2 earnings, I thought it would be a good time to run through some stats and insights. Here are a few quick hitters:
- Only 51% of companies have beat sales estimates, the five year average is 57%.
- Year over year revenue declines in the S&P 500 are expected to continue until 2016.
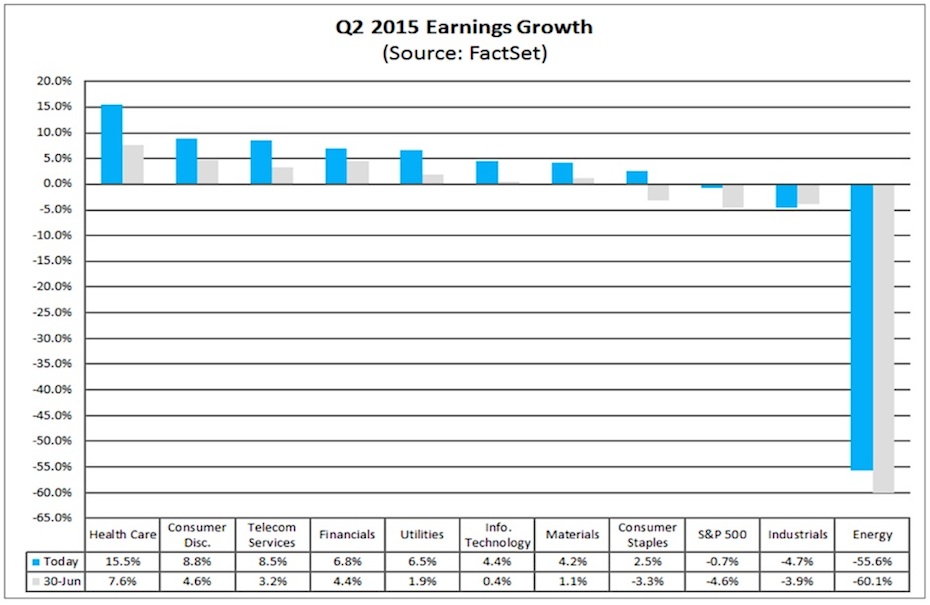
- The Industrials were the first sector to really lag outside of energy and materials. In this quarter, Industrials were the ONLY sector where earnings growth came in below expectations.
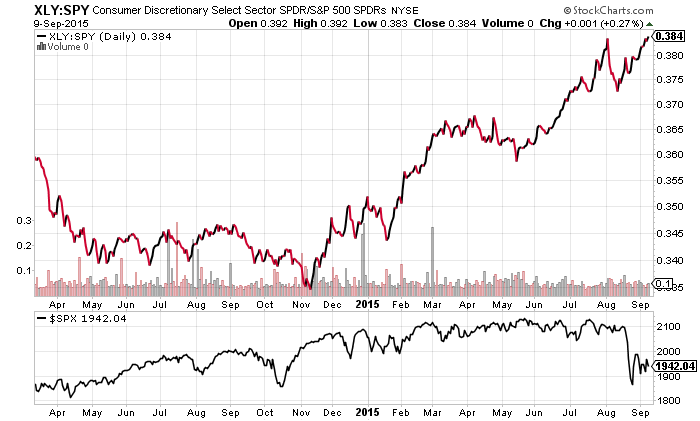
The Consumer Discretionary Sector continues to surprise to the upside with Q2 earnings. It’s no coincidence that the Consumer Discretionary Sector ETF (XLY) sits at 52 week highs relative to the S&P 500 ETF (SPY)?
It seems like the market isn’t rewarding earnings beats this quarter, and the data backs it up. Q2 earnings expectations beaters have seen only half as much ‘earnings bump’ as the last 5 years.
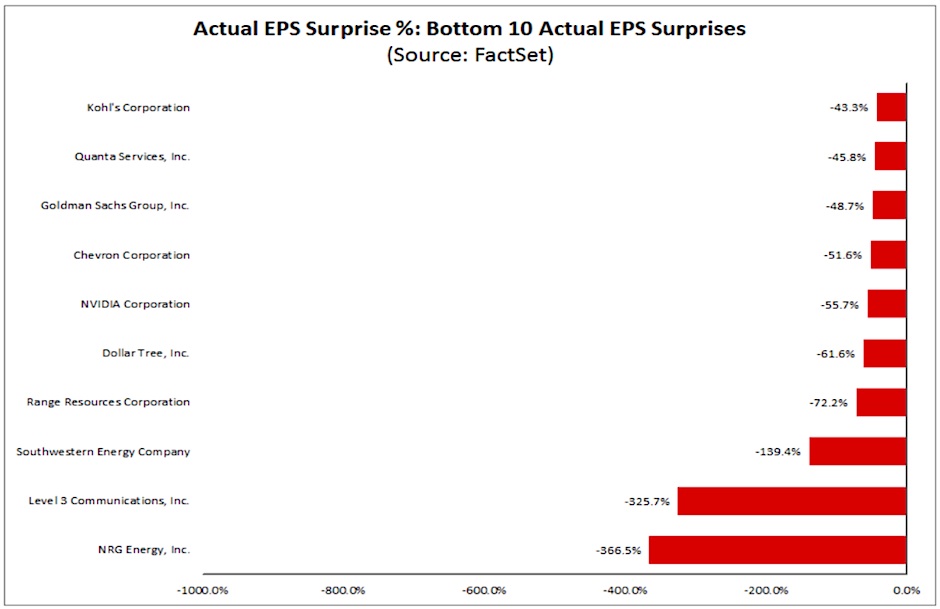
Natural gas producers and/or players Southwestern Energy Company (SWN), Range Resources Corporation (RRC), and Chevron Corporation (CVX) came in with some of the worst earnings misses in the S&P 500.
You can check out more awesome stats on Q2 earnings and more from FactSet here. Thanks for reading.
Read more from Aaron on his blog.
Twitter: @ATMcharts
Any opinions expressed herein are solely those of the author, and do not in any way represent the views or opinions of any other person or entity.

 Trading Near Top Of Price Range")


