The initial ‘advanced’ US GDP growth estimate for the first quarter of 2015 estimated that the economy grew at 0.2%. The second revision based on more accurate numbers indicated that in the first quarter the US gross domestic product actually contracted instead of growing; the number showed no growth and a decline of 0.7%. That is a significant difference from the Wall Street economists that have been predicting annual US GDP growth of 3% a year as far as the eye can see.
US GDP Growth Forecast Chart
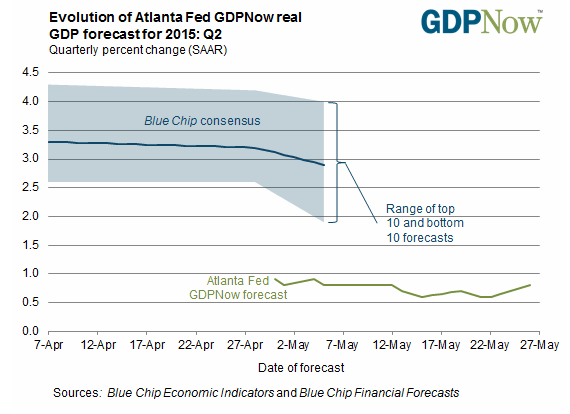
As you can see in the chart above, there is a significant disconnect between Wall Street’s ‘Blue Chip Consensus’ and the Atlanta Fed’s GDPNow forecast. The new GDPNow tool from the Atlanta Fed was the most accurate predictor of GDP in the recent releases. Growth isn’t anywhere near 3% a year and with the most recent revision showing the economy contracting, it is just one more indication that our economy continues to struggle to grow 6 years into this ‘recovery’.
The negative GDP report was positive for our bond positions. It has been a painful ride the last several months as I continued to stay invested in the 20+ Year Treasury Bond ETF (TLT) and Vanguard Extended Duration Treasury ETF (EDV) even though the positions continued to lose money. We saw gains in the fourth quarter 2014 and into January of this year. Much of those gains were erased when the bond market corrected in February and into early March. There continued to be a battle between the Wall Street “3% growth” crowd and those of us that believed the economy wasn’t growing that fast, so the correction continued into May. The negative GDP report released last week has helped bond positions and could be an indication that TLT and EDV will find their footing in the next weeks and months ahead.
In recent weekly commentaries, I have said that I believe that bonds have more potential for gain than stocks. I argued that because stocks had been at or near their all-time highs but there was little conviction to drive them higher. Since then the S&P 500 Index has pulled back while bonds have surged ahead. Since the recent GDP report was released on May 20th, EDV has gained 7.3% whereas the S&P 500 ETF (SPY) was down 0.50% (through Friday’s market close).
We aren’t out of the woods yet and the bond markets will continue to move up and down near-term. But as long as there is huge gap between the Wall Street economists’ predictions and the US GDP growth numbers that are released there is the potential for the 10-year UST to move back down to the lows it set in December of 2014. That could represent a significant gain in TLT and EDV from where we are today.
There will be a point when the US equity markets will start treating bad news as good news. In other words, the logic will be that if the economy is bad that the Fed and/or Congress will begin to take further actions to stimulate it. That will be seen as ‘positive’ for the US stock market and it could power even higher. That’s exactly what has been happening in China and Japan recently. The worse the economic data the higher the stock market goes. Anyone remember the ‘punch bowl’? And that’s when we’ll probably see the next major stock market crash happen. Lower interest rates for longer will be positive for certain stock sectors.
That’s why I have added some select ‘core’ equities to portfolios (i.e. IEFA, SCHG and VHT). I consider these positions as part of a core equity component that I intend to hold for months or years. I also have added some individual stocks that may only have holding periods of days to weeks. These include: DXJ, ETFC, ROP, ANTM, SWKS, NFLX and REGN. With emerging economies still growing faster than ours and with their penchant for devaluing their currencies relative to the USD, I like having some international exposure right now although I will continue to watch each of these holdings closely. Thanks for reading.
Jeff’s Trending Indicators
US Stock Market Trending Up* (but close to turning down)
US Bond Yields Yields Trending Down* (means prices go up)
Twitter: @JeffVoudrie
Any opinions expressed herein are solely those of the author, and do not in any way represent the views or opinions of any other person or entity.


