March continued to be bumpy for stock investors and the quarter ended on a volatile, sour note.
It seems plausible that rising interest rates are to blame, which could spell bad news for future market returns.
U.S. Market
The federal deficit is soaring under Trump’s new tax plan. In other words, the federal government is now consuming a much larger share of global savings, so there is much less available for the private sector. As a result, the 30-year mortgage is at a 4-year high, auto and credit card rates are moving higher, and globally corporations are also paying more to borrow.
At the same time, the Federal Reserve is actively pulling stimulus from the economy. The Fed drained $20 billion monthly in the first quarter of the year, which has now gone up to $30 billion for the second quarter, and increases yet again in the third quarter to $40 billion.
These dual headwinds of reduced stimulus and increased government deficit are more than just psychological challenges for the equity markets.
Stocks & Bonds
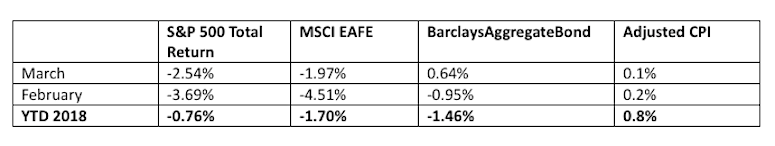
The stock market turbulence continued in March. Although it seems likely that a bond market sell-off instigated the stock sell-off, bonds started to reverse course in March slightly. Inflation has come in below expectations the past 2 months after a strong start in January. By the numbers:
Commodities & Currencies
Oil prices rose almost 5% in March, reversing their February losses and then some. For the year, crude is up over 7%. OPEC’s production cuts have gradually reduced global inventories, providing a boost to prices. Meanwhile, higher prices are pushing U.S. and non-OPEC global production higher. Energy prices remain, as always, volatile. The safe-haven of gold rose slightly in March, and is up just over 1% for the year. The dollar declined slightly in March, and for the year has declined just over 2%.
Economy
The ISM Manufacturing PMI in March was 59.3%, a bit lower than the February reading but still showing strong economic expansion. The non-manufacturing, or services, index came in at 58.8%, also showing continued strong expansion. The Commerce Department released its third estimate of fourth quarter growth, estimating that the economy grew at an annual rate of 2.9%. Currently the government estimates that GDP grew 2.3% for all of 2017.
The National Association of Realtors reports that existing-home sales in March were 1.1% higher than in February, but are 1.2% lower than they were a year ago. The median price rose 5.8% to $250,400 from a year ago. Median home prices have now been rising for the past 73 months. Distressed sales (foreclosures and short-sales) were 4% of total sales in March, unchanged from last month and down from 6% in March of last year.
Market Commentary
As rising interest rates are providing headwinds to the record bull market, I am certainly skeptical of stock market returns for the next year or two. However, in the long run, there are always good business and investment opportunities. Last month I wrote about the buying opportunities that I see as prices for coal and natural gas are near historic lows. This month we will look at the housing market.
Since the housing market bust of 2008, prices have moved inexorably higher. But good news for owners has proved to be less-so for buyers. A shortage of land, and tighter underwriting standards as a reaction to the excesses of prior years, has meant that homebuilding activity has not kept pace with demand. The Wall Street Journal reports on one study that estimates a national shortage of 7.3 million homes. The market conditions vary significantly from one state to another, from one metro area to another, but as homebuilding activity has shrunk and the population continues to grow, there is broad agreement on the fundamental issue. “We have a housing deficit,” says Chris Herbert, managing director at Harvard University’s Joint Center for Housing Studies. “I think we can all agree we should be building more.”
This could bode well for the long-term stock prices of homebuilders. Tempering this enthusiasm is the shorter-term trend of rising interest rates – as the average 30-year mortgage rate has crept higher, housing sales have fallen. In the long run, for companies to build more homes, local zoning rules might need to be changed, Americans’ real incomes will need to move higher, or interest rates will need to move lower. The demand is there – homebuilding businesses just need to find a way to profitably build homes that can satisfy that demand.
Author Disclaimer: This material was prepared by Greg Naylor, and all views within are expressly his. This information should not be construed as investment, tax or legal advice and may not be relied upon for the purpose of avoiding any Federal tax liability. This is not a solicitation or recommendation to purchase or sell any investment or insurance product or service, and should not be relied upon as such. The S&P500, MSCI EAFE and Barclays Aggregate Bond Index are indexes. It is not possible to invest directly in an index. The information is based on sources believed to be reliable, but its accuracy is not guaranteed.
Investing involves risks and investors may incur a profit or a loss. Past performance is not an indication of future results. There is no guarantee that a diversified portfolio will outperform a non-diversified portfolio in any given market environment. No investment strategy can guarantee a profit or protect against loss in periods of declining values. Listed entities are not affiliated.
Data Sources:
www.standardandpoors.com – S&P 500 information
www.msci.com – MSCI EAFE information
www.barcap.com – Barclays Aggregate Bond information
www.bloomberg.com – U.S. Dollar & commodities performance
www.realtor.org – Housing market data
www.bea.gov – GDP numbers
www.bls.gov – CPI and unemployment numbers
www.commerce.gov – Consumer spending data
www.napm.org – PMI numbers
www.bigcharts.com – NYMEX crude prices, gold and other commodities
https://www.wsj.com/articles/just-how-widespread-is-the-housing-shortage-1523876401 – housing market quote and statistics
Any opinions expressed herein are solely those of the author, and do not in any way represent the views or opinions of any other person or entity.


 Showing Bullish Buy Potential")


