If you’re new to trading or have been at this business for decades, you will be well aware of the age-old adage “price compression leads to expansion” or even more common, “the larger the base, the higher in space”.
Both of these are vitally important and immensely true in regards to analyzing charts and determining the direction of the security. This concept has it’s foundation in another very old idea, a physics principle; “Extension is directly proportional to force [upon removing force hindering the object]”.
In other words, price compression leads to expansion upon the removal of the force that is “compressing” the object (or in this case, a stock). In our case, the force would be the supply (or demand) of market players. Therefore, when supply is decreased (or demand) to point of relieving the pressure of the price compression, the stock will expand. It should be noted, that in our case, the supply creates resistance and demand creates support.
Technical analysis is not as complicated as it’s made out to be sometimes. Technical analysis is quite literally, the real world portrayed in the price action of financial securities, as evidenced by this physics principle working it’s way into technical trading.
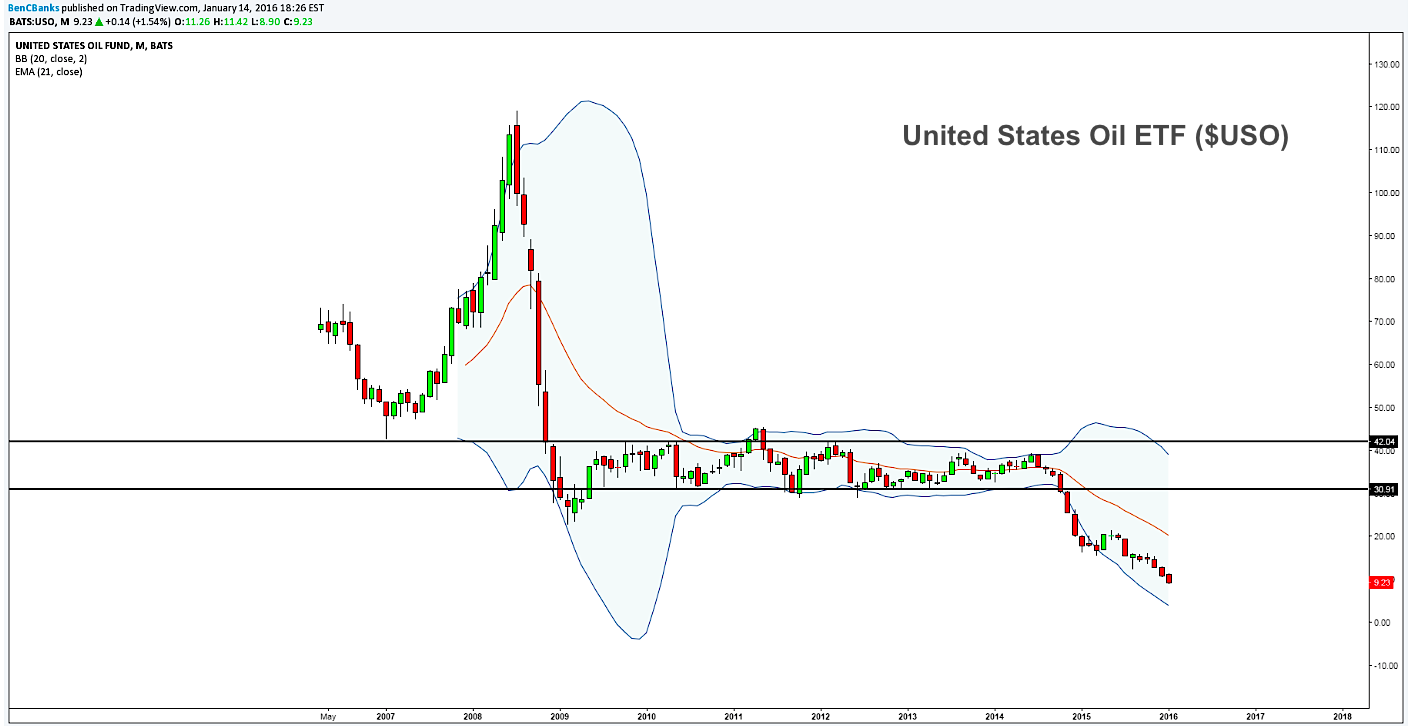
Below is one of the best example of the best decade of the phenomenon. The chart seen below is a monthly chart of the United States Oil ETF $USO (which tracks Crude Oil prices). As seen in price action, there was a massive expansion, then a massive (de)expansion, then a massive consolidation (or contraction) in which the supply and demand created forces on the price that constricted further price movement. Finally, upon the lifting of the supply and demand, the oil prices expanded once again. See chart below of crude oil prices proxy ETF.
The point of this explanation and pattern is this; we need to be able to recognize these pattern if we’re ever planning to be successful traders. We need to be able to see this pattern and say to ourselves “This is a pattern that will expand in the future, which way will it is expand where should my stop loss be based on this reality?”
It should be noted that this pattern is seen all over the place, from monthly, to weekly, to daily and to intraday charts; it’s everywhere. Do not be afraid to trade this pattern on any timeframe. It’s the same technicals on the intraday charts and it is on the monthly.
Good luck to all and if you have any questions, don’t hesitate to contact me or comment below. Thanks for reading.
Twitter: @BenCBanks
Read more on Ben’s Blog.
Any opinions expressed herein are solely those of the author, and do not in any way represent the views or opinions of any other person or entity.


: Showing Some Signs of Emerging Strength")
