In our late January post about the S&P 500 Index, we said the expected top was probably in place. Recent price action has caused us to revise that bearish position, and we now have a near-term bullish scenario as our primary one.
A really valuable aspect of Elliott wave methods is that they show you how far price can reasonably go before you need to revise your analysis and maybe reposition your trades. We’re seeing some indications our earlier bearish forecast might be wrong for the near-term, so we wanted to present the technical case for a moderately bullish view going into late spring.
And as always, we’ll identify what kind of price behavior would suggest that our new, moderately bullish scenario is itself wrong. Being unbiased is another valuable part of Elliott wave!
In our little branch of technical analysis, the most important price advances usually consist of five waves – three up interspersed with two down. Among those waves, downward wave number four often represents the moment of “maximum fear” that a reversal or downward breakout will take place. This sometimes coincides with the moment of “maximum fear” in some aspect of real-world events.
In terms of market sentiment, the current moment fits the “maximum fear” profile that often precedes the final rally in a sequence. Today’s article makes the case that the S&P 500 Index can climb to a moderately higher high during the next two or three months, even though it probably won’t stay up there for very long.
The weekly chart shows a revised upward Elliott wave count out of the “COVID panic” fourth wave that ended in early 2020. It treats the current decline as a similar fear-based event, just one order of magnitude smaller than the earlier one. In this scenario, price can reach one last moderately higher high in a climb we would label as wave (v) of [v].
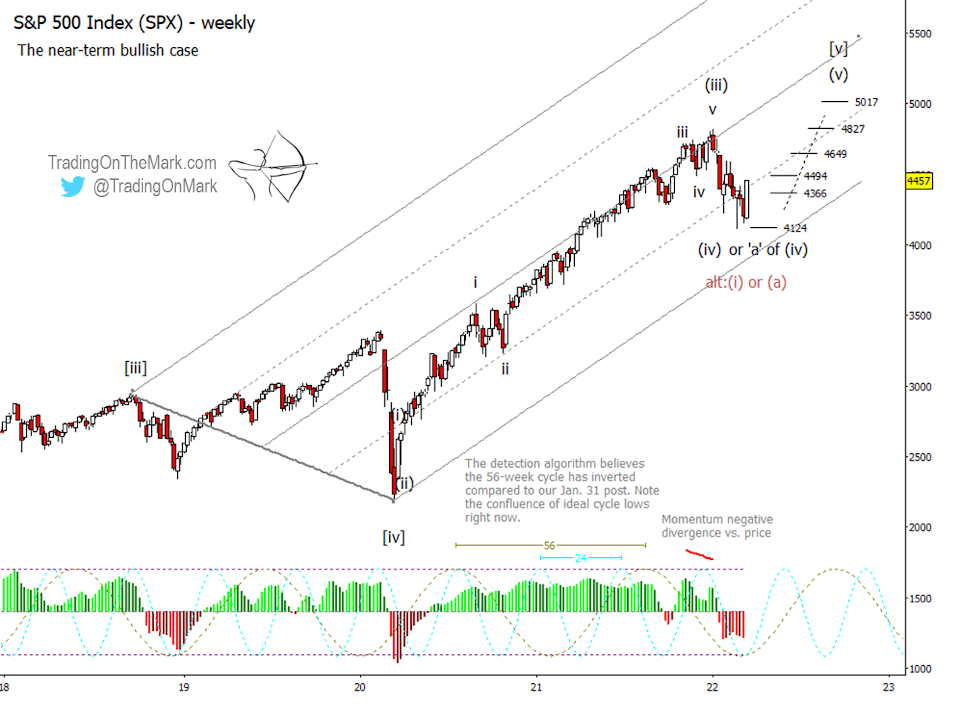
The pattern of the recent decline looks corrective, as a fourth wave must be. We also note there appears to be a higher low forming, with 4124 acting as support.
A first confirmation of the bullish scenario would be a break and weekly close above 4366, which might be happening as of the writing of this article. The next area of confirmation for more conservative traders is at 4494. If price takes off from there, interim upward targets would include 4649, 4827 and 5017 based on the assumption the recent low holds.
Another piece of evidence for a near-term rally shows up in the newly inverted 56-week price cycle, as detected by a proprietary algorithm. Compare it to the equivalent cycle in our earlier post and note how the ideal lows for the currently projected fast and slow cycles now coincide.
A variant of the moderately bullish scenario would have this year’s decline be merely the first part – sub-wave ‘a’ – of corrective wave (iv). That means the market could swing up and down again to test the edges of this year’s range or to waste time waiting for real-world events to catch up.
We have demoted the bearish scenario described in our previous post, making it the alternative now. Keeping with an unbiased approach, we note that the signs of the bearish case again gaining favor would consist of a weekly close beneath 4124 and/or a weekly close solidly beneath the lower edge of the channel drawn on the chart.
Even though we’re somewhat bullish, this is a very risky point on the chart for bulls. In a different light, it’s also a potentially risky point for any bears who are trading without deep pockets and who would be frightened out of the market if it rallies to a new high. Every trader needs to decide what level of risk is acceptable, and we don’t provide any advice in that regard.
We see additional evidence for the bullish case in the rallies taking place in Hong Kong and European equity indices.
You can get daily charts and updates for this and other highly traded markets via our subscription page on Substack and on Twitter.
Twitter: @TradingOnMark
The authors may have a position in the mentioned securities at the time of publication. Any opinions expressed herein are solely those of the author, and do not in any way represent the views or opinions of any other person or entity.


