There have been some interesting developments in the markets during the past few weeks. They could be signaling some warning signs, so I’d like to bring these developments to your attention with some charts I’ve been watching.
Let’s get right into it.
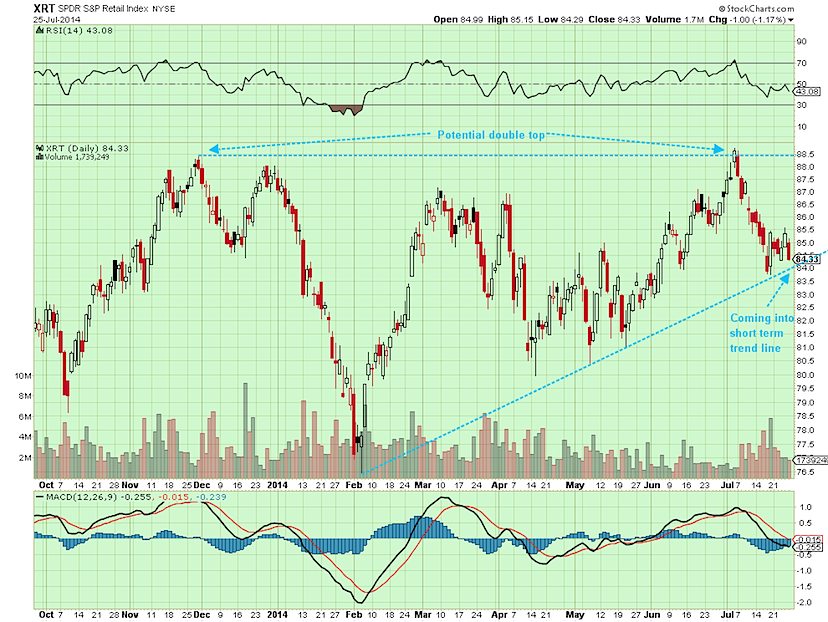
The first set of charts takes a look at the retailers via the Retail Index ETF (XRT). As you can see from the chart below, the XRT found some resistance at old all time highs, and is potentially working on a double top. It is also important to point out that it’s coming into short-term trend line support.
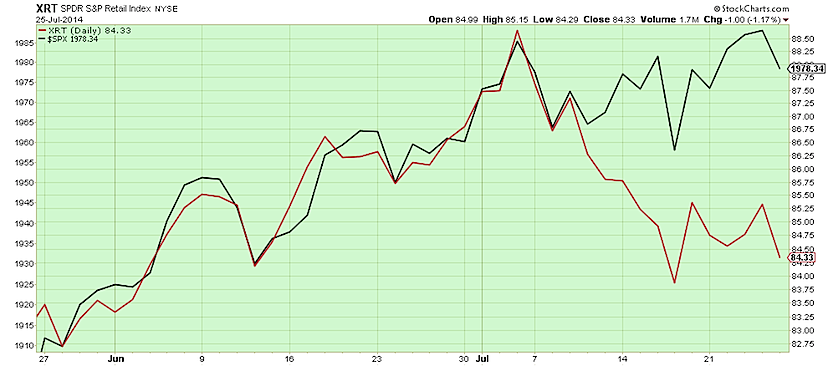
The second chart of the retailers ETF shows that the XRT (in red) has started to underperform the S&P 500 (in black). We saw this similar type of underperformance in January which ended up being a sign of things to come for the S&P. These type of warning signs bear watching near to intermediate term.
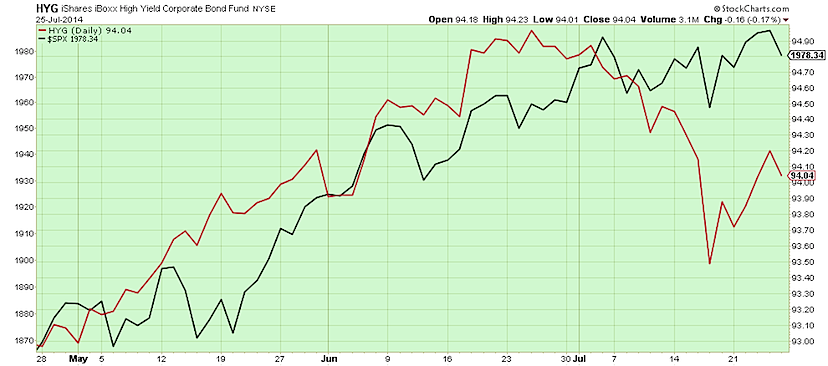
The next chart shows that the High Yield Corporate Bonds ETF (HYG) has started to underperform vs. the S&P 500 as well. Is this a short term phenomenon or will it continue?
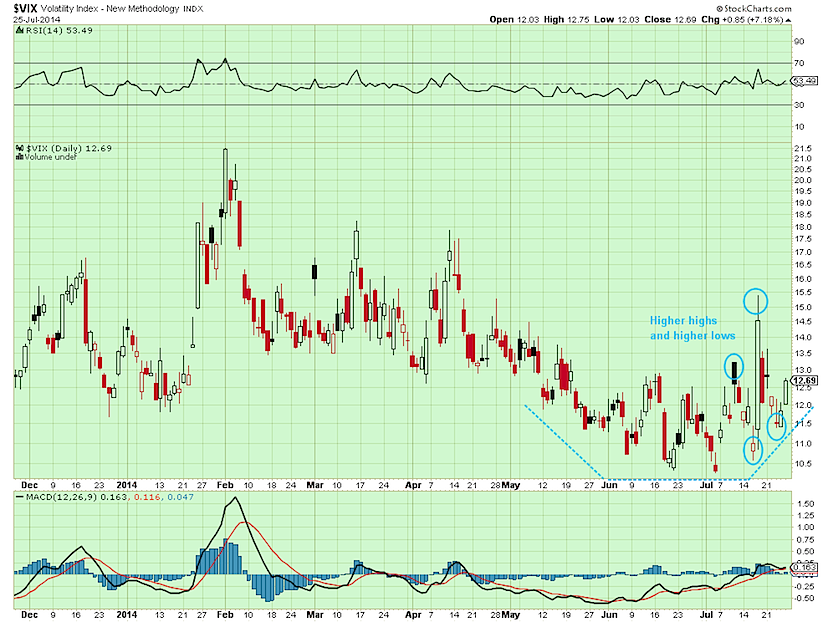
Below is a chart of the Volatility Index (VIX). It shows that it has stopped making new lows and has in fact changed its short term trend. This is interesting because the S&P 500 has actually made new all time highs in recent weeks. This is important to monitor over a long period to see if this continues, as it could be signaling some turbulence for the markets.
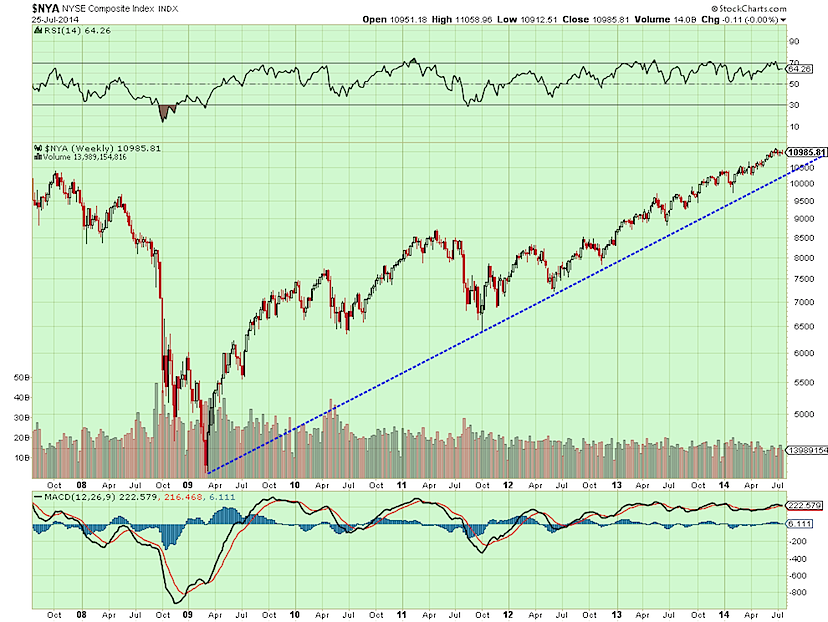
It is also important to remember that the long term trend of the markets is still up. The next few charts show this.
NYSE Long-Term Weekly Chart
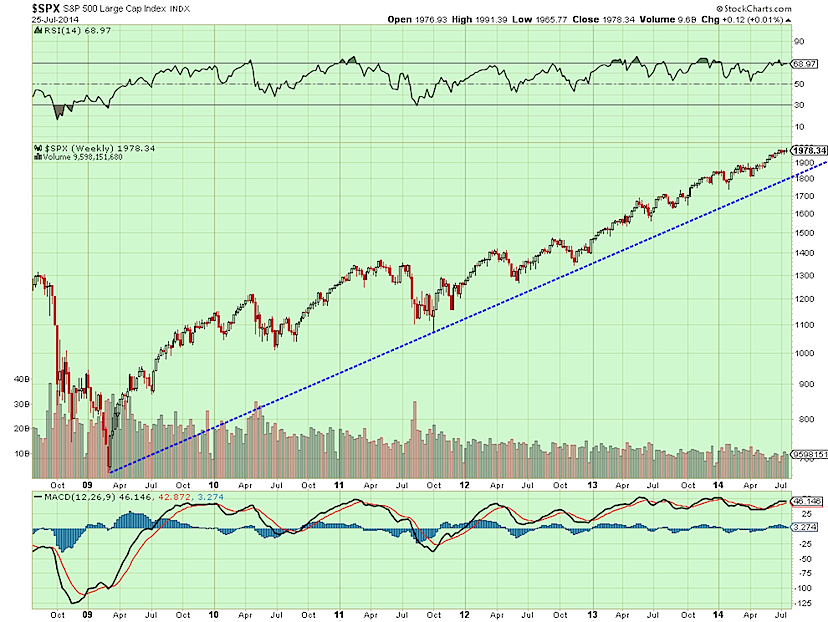
S&P 500 Longer-Term Trend Line
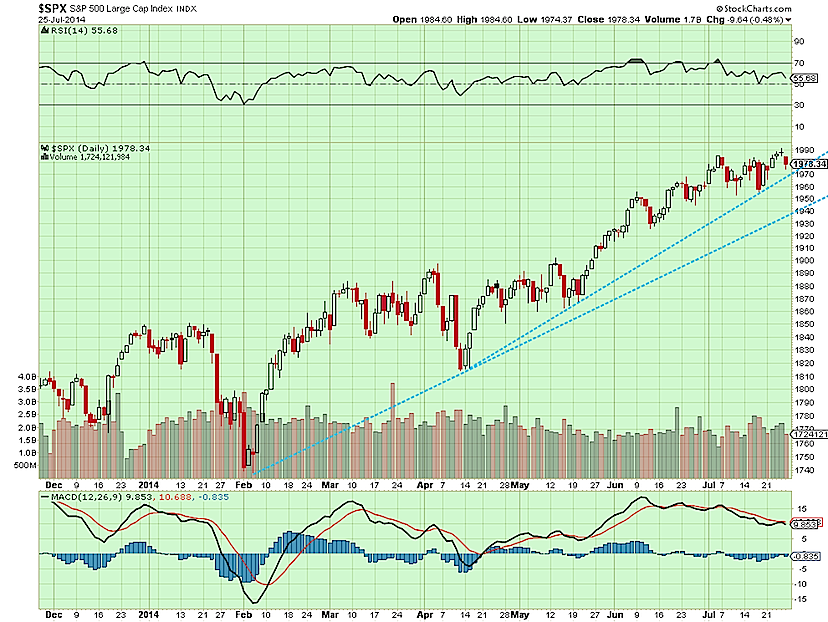
The year to date trend in the S&P 500 is still valid as well. Here’s the chart to illustrate that:
S&P 500 2014 Trend Line Support
Will these warning signs be a “signal” for the overall markets? Only time will tell, but it’s important to keep monitoring these to see if it continues. It’s also important to remember that the long term trend for the markets is still higher. Thank you for reading.
No position in any of the mentioned securities at the time of publication. Any opinions expressed herein are solely those of the author, and do not in any way represent the views or opinions of any other person or entity.


 Testing Important Price Support")


