Are Q1’s Frigid Economic Performance And Resulting Fears of Recession About to Thaw in Light of a Sunny 2nd Quarter GDP Print? Will the Market Warm to a Positive Report; or Could July’s Gains Melt Away Instead?
At 8:30 a.m. ET this Wednesday the Bureau of Economic Analysis (BEA) will release it’s Advance GDP reading for April-June 2014, the first of three monthly reports covering 2nd Quarter GDP. Despite Q1’s abysmal and recession-like -2.9% print, a wide range of observers including Fed Chair Janet Yellen see the dip as “transitory” and are looking for an aggressive bounce-back in Q2 followed by a stronger second half.
Q1 2014 was unique in many ways: the Dow Jones Industrial Average (DJIA) preceded it’s negative GDP print with an advance (something that has happened only 5/25 times since 1947) over the preceding year matched only one other time (Q2 1981) in history. In the year following that quarter, the DJIA lost -16.09% (read the full study including these statistics here).
So what should we expect from stocks if Q2 GDP prints at 3% or better, signaling a quarter-over-quarter change in GDP growth of 6%+?
Since the BEA began keeping records in 1947, Q/Q GDP Growth:
- Has swung +6% or more in 19 of 268 quarters (since 1947); or 7% of the time
- Has swung +6% or more in 1 of 120 quarters (since 1984); or 0.08% of the time
- Has not swung +6% or more since Q2 2000, for 55 quarters running – the second largest gap after 1982-2000’s 71 quarters.
- In 14 of 19 occurrences, or 74% of the time, the Q/Q swing has occurred in close proximity to a recession (as defined by NBER)
- Has been followed in the reporting quarter (i.e. the quarter following) by positive DJIA performance 10/19 times, or 52.7% of the time.
- Has been followed by an average net performance in the reporting quarter of +0.5% (excluding Q3-to-date 2014)
- Has been followed by an average net performance in the reporting quarter of +0.9% (excluding Q3-to-date 2014)
- Best performance following a 6% Q/Q swing: +11.5% (in Q3 1982)
- Worst performance following a 6% Q/Q swing -9.6% (in Q3 1975)
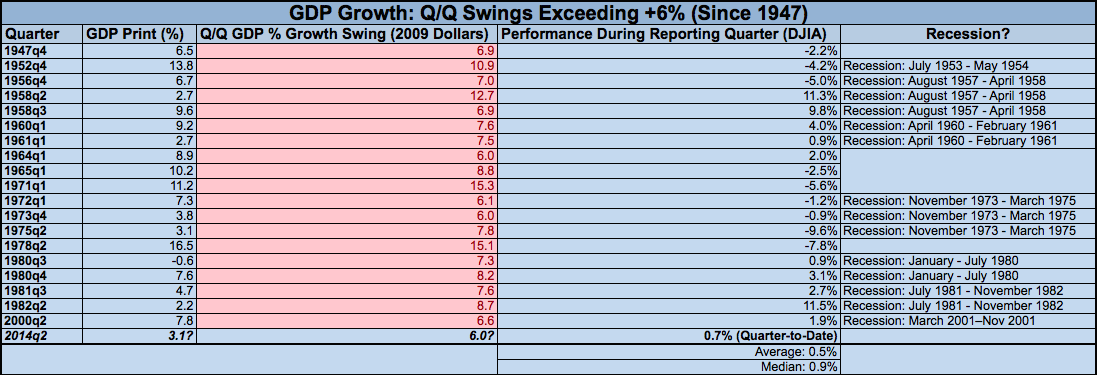
With the DJIA’s Q3 2014 performance quarter-to-date (through July 25) of +0.7%, stocks are already performing exactly in-line (mid-way between the historic average and median) with 2 months remaining. There’s minimal correlation between the size of the swing and the reporting quarter’s return, but of the occurrences registering an >8% Q/Q swing, stocks were negative in 4/7 or 57% of occurrences while occurrences >10% were negative 3/4 or 75% of the time.
It’s worth remember Q1 2014’s negative GDP print had a positive trailing annual return. Of the four previous times this occurred in history (Q4 1949, Q2 1980, Q2 1981, Q1 2008), only 2-of-4 had a positive return over the next 12 months. 4 months into the rolling 12-month period following Q1, DJIA is currently +3.1%. The average and median subsequent 12-month returns of the 4 occurrences preceding it? -7.04% and, -2.05% respectively, or -10.14% and -5.15% from current levels.
Twitter: @andrewunknown and @seeitmarket
Author holds no exposure to securities mentioned at the time of publication. Commentary provided is for educational purposes only and in no way constitutes trading or investment advice. Ice sculpture by Nele Azevedo, image via theAtlantic.com


