European equity markets have participated in the global rally off the January and February lows, but those tactical bounces come within the context of many longer-term downtrends relative to the S&P 500. One European country that looks particularly vulnerable is Poland and the Poland stock market. Today, we’ll focus on the chart of the iShares Poland ETF (EPOL).
The daily chart of EPOL provides us with a tactical perspective of the roughly 31% rally off of the January 21st lows. Though impressive, the rally in the Poland ETF has recently given way to new “technical” concerns.
Here are a few.
Earlier this month, prices made new marginal highs and tested prior support at the 2012 lows, but momentum made a lower high. Prices then broke down below the 3/18 highs, 61.8% retracement of the Sep-Jan decline, and the uptrend line from the February lows to confirm this bearish divergence and failed breakout.
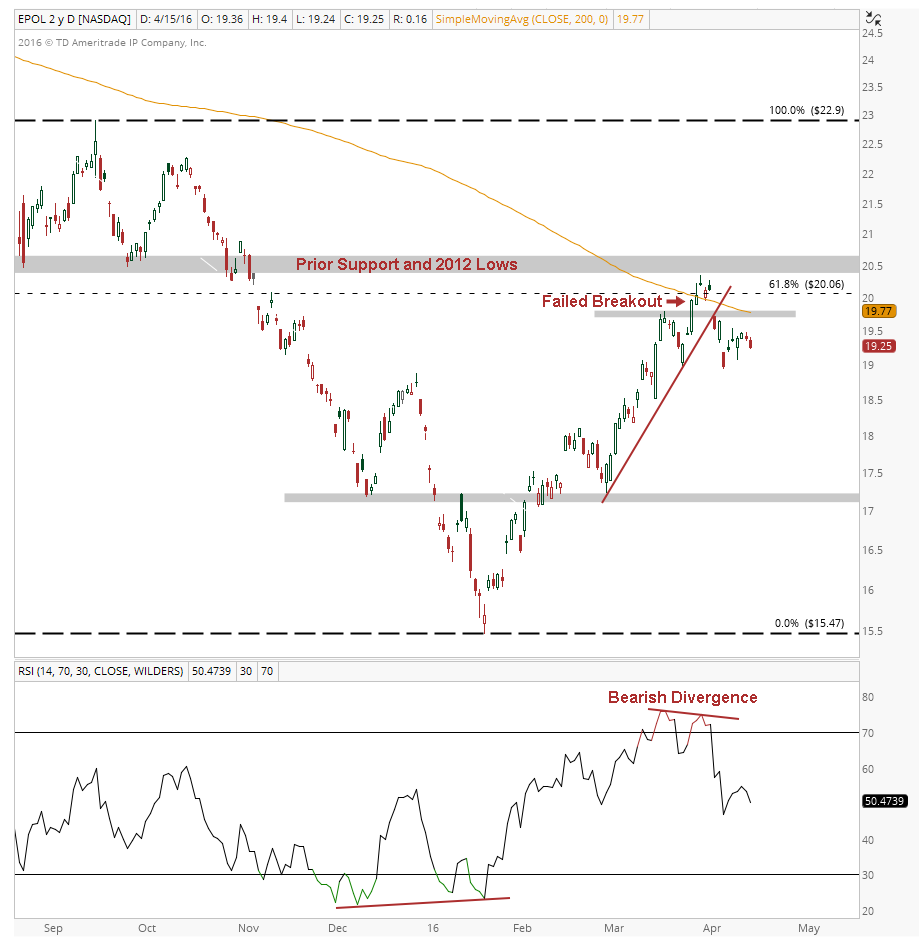
The downward sloping 200 day indicates prices are still in a long-term downtrend, which suggests the recent pressure on prices is totally normal. The current weight of evidence suggests the bias remains to the downside as long as the Poland ETF (EPOL) remains below the 3/18 highs of 19.79 on a daily closing basis. If prices remain below that level, they look vulnerable to test prior support at 17.15 and the all-time lows of 15.47.
As I mentioned at the top of the post, many European equity ETFs are in long-term downtrends relative to the S&P 500 and Poland is no exception. The daily chart of the iShares MSCI Poland ETF / S&P 500 represents this relationship.
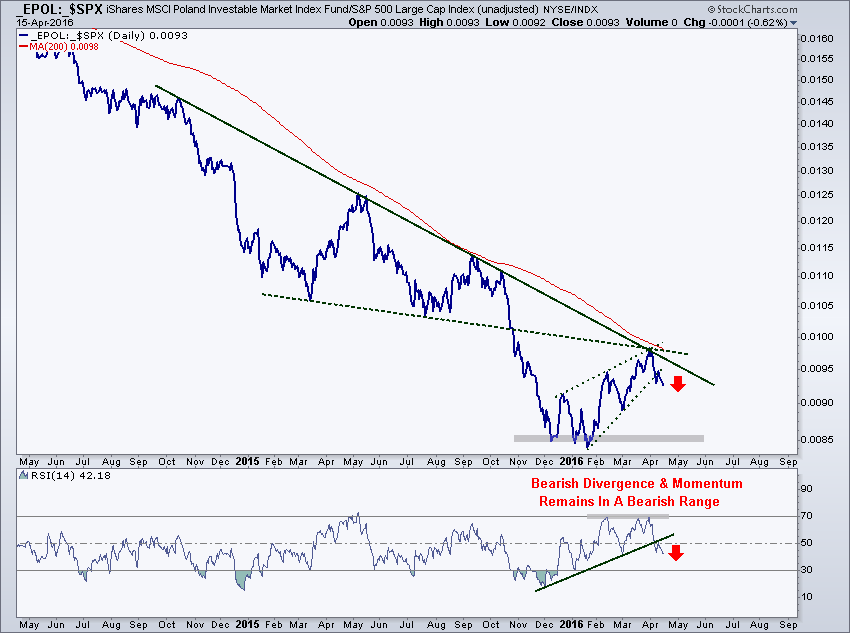
As the chart shows, this ratio put in a failed breakdown in late January and subsequently outperformed the S&P 500 during the rally that global equity markets experienced off the January lows. Despite its aggressive move higher, momentum failed to make new highs as price did, keeping its bearish range intact. Additionally, the 200 day moving average is still downward sloping, suggesting the long-term trend in this ratio remains lower.
The above factors, combined with prices failing to break above the confluence of resistance of 0.0098, suggest the bias has shifted back to the downside. The current weight of evidence suggests to me that this ratio is likely to retest the all-time lows made earlier this year.
The Bottom Line: This weakness in the Poland ETF (and Poland stock market) is one symptom of the much larger theme that’s been intact for years; European under-performance. Whether you choose to trade these particular setups or not, I think they both provide valuable insight into just how weak even those European markets that have led YTD are over the long-term.
As long as we’re below the levels discussed above, the shorts remain in control of this market. What would be most constructive for this market on an absolute and relative basis is a correction through time. If prices can continue to consolidate over the next several weeks and months, the long-term downtrend can begin to reverse and turn higher. I think that is the lower probability outcome, but I’m staying open minded and will adjust my view as the weight of evidence changes.
As always, if you have any questions feel free to reach out and I’ll get back to you as soon as I can.
Twitter: @BruniCharting
The author does not have a position in any of mentioned securities at the time of publication. Any opinions expressed herein are solely those of the author, and do not in any way represent the views or opinions of any other person or entity.


: Showing Some Signs of Emerging Strength")
