For those of you who have read a couple of my posts here, it is known that I enjoy referencing and discussing point and figure charts.
Indeed my last post for See It Market was a post about the first sell signal generated in the S&P 500 (SPX) by a double bottom sell signal that occurred in October. It was the first such point and figure signal since the double top buy signal in June 2012.
To be clear, I am referencing 1% by 3 box reversal metrics. At the time of that writing I suggested that although caution was warranted, the uptrend was very much alive. In fact that is what has been confirmed and is the reason for the new post.
Instead of highlighting just the longer term 3 box reversal, I am also including a chart of a one box reversal for the SPX. One can notice that being a shorter-term chart there is more ebb and flow of the price change as seen by more frequent shifts from up columns to down columns. After finding its footing, the SPX has seen a very robust rebound with the first buy signal occurring at 1986.1 on the 1 box reversal. However, there still remained resistance at 2006 and we needed to see a print of 2026 to break through that area, which is what we saw yesterday. Also we saw a breakout above the top Bollinger band and the trend of the middle band is still up.
S&P 500 – Point and Figure 1% by 1 box Chart
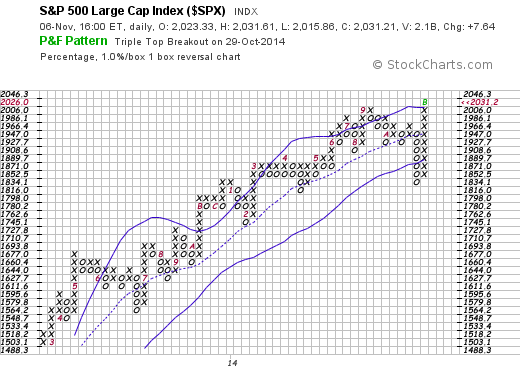
Onto the longer term trend. Looking at the 1% by 3 box reversal soon after the double bottom sell signal was generated there was still some continued downside pressure as seen by the column of O’s. After seeing volatility spike in the Volatility Index (VIX) and extreme risk off behavior that occurred in the spike in treasuries, buying interest returned to the SPX highlighted by the column of X’s. What’s important to note is once the buying began, there was follow through. And further, there wasn’t a change in columns to show any selling as the buying continued. What indeed occurred is upward pressure in price which generated a double top buy signal yesterday when SPX printed 2026. Again, positive point and figure signals for the SPX.
S&P 500 – Point and Figure 1% by 3 box Chart
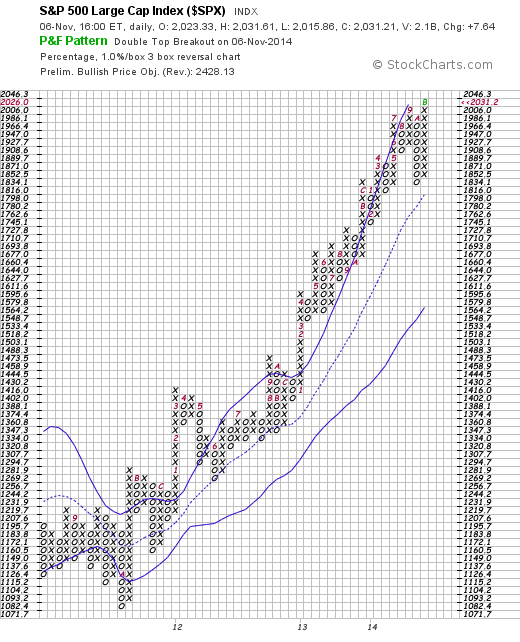
So why did I show both charts this time? One to show something a little different. And second because both the shorter-term and longer-term charts are confirming each other in what has been a very strong upward trend since the double top buy signal generated in June 2012. It’s also interesting that the new point and figure signals (buys) occurred in early November which is the beginning of a positive period of seasonality for stocks (i.e. the best six months of the year). As a market analyst I’m always on the lookout for an edge and point and figure signals are great to have in my toolkit. Thanks for reading
Follow Karl on Twitter: @Snyder_Karl
No position in any of the mentioned securities at the time of publication. Any opinions expressed herein are solely those of the author, and do not in any way represent the views or opinions of any other person or entity.


