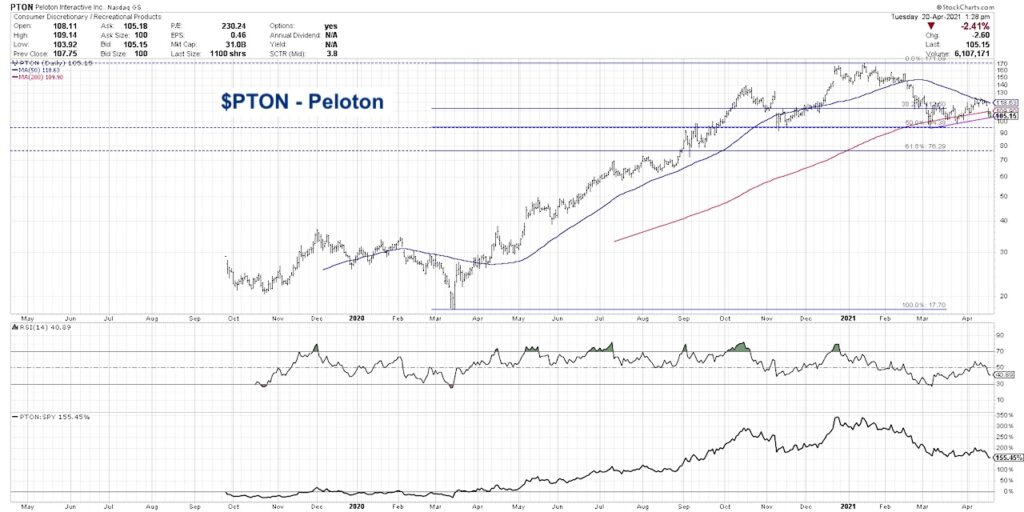
The term “head and shoulders top” is often thrown around when a stock starts to show signs of distribution. As the work-from-home stocks have struggled recently, charts like Peloton Interactive (PTON) have transitioned from an accumulation phase to a distribution phase causing investors to question their long-term prospects.
In today’s video, we’ll use the current chart of PTON to illustrate how to determine a head and shoulders top, what key levels come into play, and what this pattern could mean for the short-term and long-term outlook for this key growth name. Here are some of the discussion topics:
– How to determine whether a head and shoulders pattern is a valid sell signal or requires further confirmation.
– How the price patterns for Peloton relate to other technical indicators like moving averages and Fibonacci retracements.
– What price action would invalidate the head and shoulders top and suggest a new impending uptrend.
For deeper dives into market awareness, investor psychology and routines, check out my YouTube channel!
One Chart: $PTON Peloton [VIDEO]
Twitter: @DKellerCMT
The author may have positions in mentioned securities at the time of publication. Any opinions expressed herein are solely those of the author, and do not in any way represent the views or opinions of any other person or entity.


