Apple’s stock is up over 20% since the market peak in February.
Without a doubt, Apple NASDAQ: AAPL, the company, is worse off due to the crisis and global recession.
Revenue and earnings will be inferior to what Wall Street had forecast at lower stock prices. Valuations, shown below, are now astronomical.
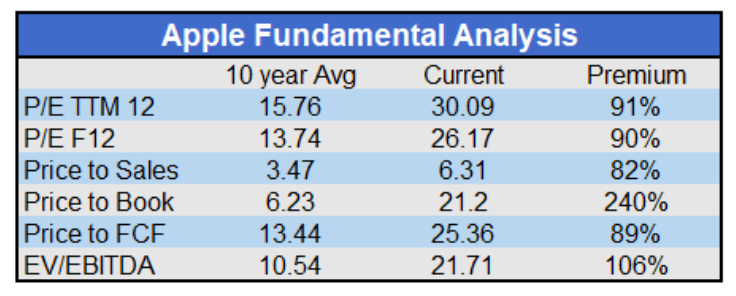
So who is paying a higher price for Apple (AAPL) with the promise of less?
Let us be more direct. Why do investors prefer stocks based on the size of the company versus its valuation?
The popularity of passive investment strategies has grown markedly over the last thirty years. Throughout the period, these strategies have increasingly become a more significant factor in asset pricing.
It now appears as though passive investors may be the marginal investor, also known as the price setter.
There is mounting evidence that passive investors are the driver of recent inane market behavior.
For more background on passive strategies, please read our articles Passive Negligence and Passive Negligence Part 2.
Market Cap Weighted vs. Equally Weighted
The rally from the March lows has been odd. Big tech companies have carried the water, but at times bankrupted companies and the hardest-hit sectors, such as airlines and cruise lines, have gapped higher without apparent reason. Sector rotation has been fast and furious.
One of the more consistent trends has been a preference for the largest companies by market cap.
The graph below compares the equal-weighted S&P 500 (blue) to the S&P 500 (orange -market-weighted).
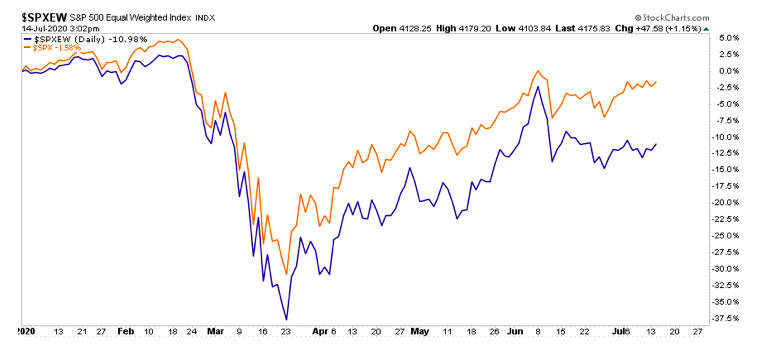
Year to date, the S&P 500 is beating the equal-weighted S&P 500 by about 8.50%.
The next table provides more context as to what investors are buying and shunning.
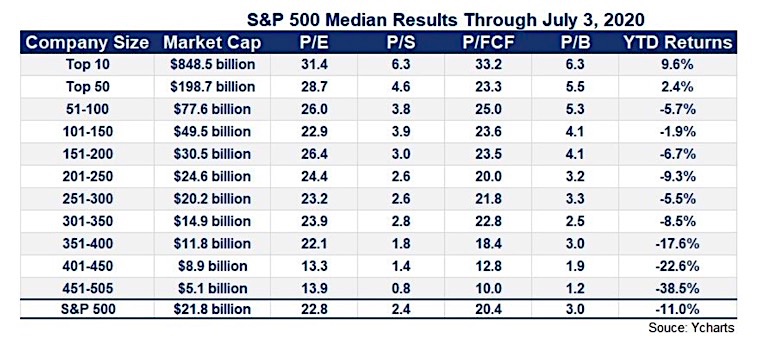
As shown, year to date, through July, stock performance is well correlated with market cap. Also note, the companies with the best valuations are at the bottom and the worst are at the top. Whether passive investors know it or not, they are buying the most expensive companies.
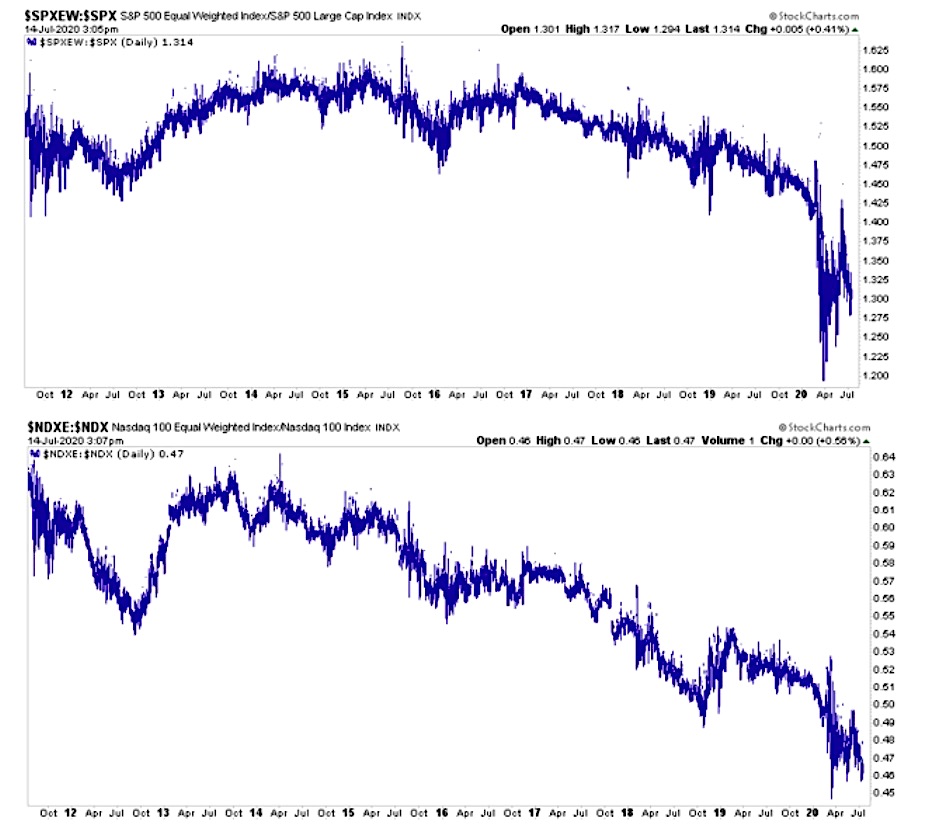
The two graphs below provide historical context for the outperformance of the largest S&P 500 and NASDAQ stocks. In both graphs, the equal-weighted index, as a ratio to the weighted index, has been underperforming for the better part of four years.
Passive Fingerprints
The evidence above suggests that investors currently prefer large overpriced companies. While that is what many investors are buying, the decision, in most cases, is not a conscious one.
Passive investors tend to invest in indexes of markets or sectors. Most of the popular ones are weighted by market cap.
When someone buys a market-weighted index like the S&P or NASDAQ, by default, they buy more of the largest companies and less of the smaller companies. For example, for every $100 invested in the S&P 500, an investor buys $6.15 of Microsoft but only .01 cent of Xerox.
The purchases put upward pressure on Microsoft shares but do little for Xerox. In a circular fashion, as indexes rise, the weighting diverges further.
When passive investing is the primary driver of prices, markets become a story of the haves and have nots.
Think of the scenario like a rubber band stretching. As it stretches more and more stocks deviate from each other. Eventually, the rubber band will either snap back or break.
Where are the Active Police?
Typically active investors, those discriminating based on fundamental and technical factors, play a significant role in the pricing process. By favoring what is cheap and selling what is expensive, they reduce pricing anomalies. That does not mean markets are efficient, but active investors make them more efficient than they would be otherwise.
Active investors historically “police” markets and ensure order prevails among the valuations of companies. Today, the active police have little force. A mob of passive investors is overrunning them. Literally, the active police are being defunded.
Also, in a circular fashion, underperforming active strategies drive passive strategies. Poor returns from active managers versus better returns for passive managers, cause investors to chase passive alternatives. As money flows out of active and into passive, the pricing anomalies grow.
Value Versus Growth
Passive strategies have taken enormous market share from active managers over the last decade. The clues are seen in short term inefficiencies like the table shown above. One can also witness them in long term, once dependable rules of thumb.
For example, over extended periods, investors were rewarded for owning companies with the best fundamentals. The graph below shows the total return of the top 20% versus the bottom 20% as measured by earnings to price. As shown, for the last five years, investors buying stronger companies were punished versus those buying weak companies. The only other instance this occurred was briefly before the Tech crash of 2000.
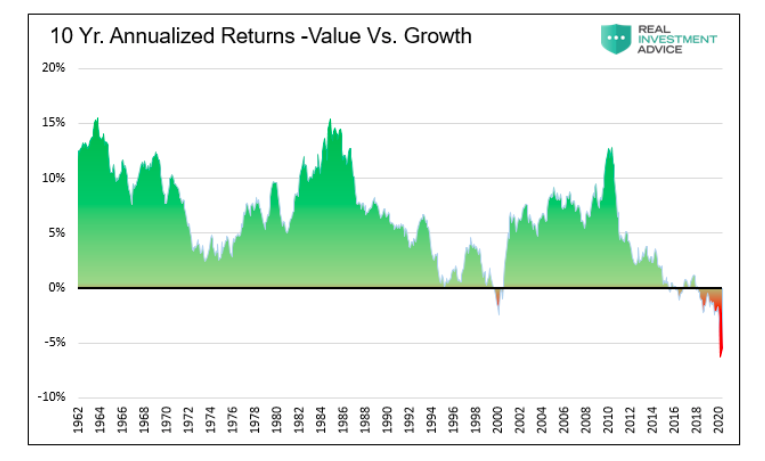
In the past, value investors would take advantage of that tremendous opportunity. Today, it represents career risk as they lose their jobs to passive investors. Like the irrational behavior around the tech boom, this too will end, but no one knows where the tipping point will be.
Economists Take Note
This topic is not just of importance to investors. The underlying theme has serious consequences for the economy.
Passive investing is, by definition, a misallocation of capital. Stocks are bought based on market cap. Passive investors do not acquire them for their ability to create productive economic growth and generate healthy earnings streams. The more capital squandered chasing companies with low growth potential and/or are poorly run, the lower productivity growth will be.
As we have written, productivity growth is essential. Without it, the economy will continue to rely on more debt to grow. That is an unsustainable model for prosperity.
Summary
The current situation is concerning as an investor and citizen of the United States. As in bubbles, market anomalies may continue well beyond what makes sense. However, bubbles always pop, and the consequences are usually devastating; more so for the poor than for the wealthy.
Importantly, when the market declines and passive investors are net sellers, they must sell $6.15 of Microsoft for every penny of Xerox. This article is not a recommendation to buy Xerox. However, we hope it implores you to explore lesser followed companies with good fundamentals, especially those not included in index funds. As was the case in the aftermath of the bursting of the tech bubble, this is where you will find several gems.
Twitter: @michaellebowitz
Any opinions expressed herein are solely those of the author, and do not in any way represent the views or opinions of any other person or entity.


: Showing Some Signs of Emerging Strength")
