Complacency is finally abating as options traders ramp up their put buying.
On Tuesday, we noted that the sentiment climate had finally shifted away from its overly bullish or complacent condition. This rampant bullishness had us concerned about the downside risk in the stock market starting back in August (e.g., see our August 19 post: “Investor Complacency Is Smashing Records”).
As we noted in Tuesday’s post (which was almost a mirror-image of the Aug 19 post), near-term volatility expectations were being ramped up to historic relative extremes. Today, we look at an options market indicator that has completely shifted from complacency to extreme anxiety.
There are many stock options ratios available that measure the level of put options activity to call options activity. 2 of our favorite options market indicators are the CBOE Equity Put/Call Ratio and the ISE Equity Call/Put Ratio. One reason we like them is due to their focus on equities alone rather than indices, ETF’s, etc. As a result, they tend to paint a purer picture of investor sentiment toward the stock market. When either series sees the level of put activity elevated versus calls, it is an indication of fear or anxiety on the part of these traders.
Now, as you may have picked up on, the CBOE places puts in the numerator while the ISE places them in the denominator. Neither is right or wrong, just different ways of expressing the ratio. One nice way of viewing the overall options sentiment picture is to divide the CBOE Equity Put/Call Ratio by the ISEE Call/Put Ratio. Since a high CBOE ratio is indicative of fear as is a low ISEE figure, the higher the CBOE/ISEE number is, the more fear that is present, in the way of relative put activity.
Historically, we have found the nice, round number of “1.00″ to be indicative of an extreme level of puts relative to calls. That is, when the CBOE Equity Put/Call Ratio is higher than the ISEE Call/Put Ratio. Since the inception of the ISE in 2006, there have been 28 days registering a reading of 1 or higher, with yesterday being the latest occurrence.
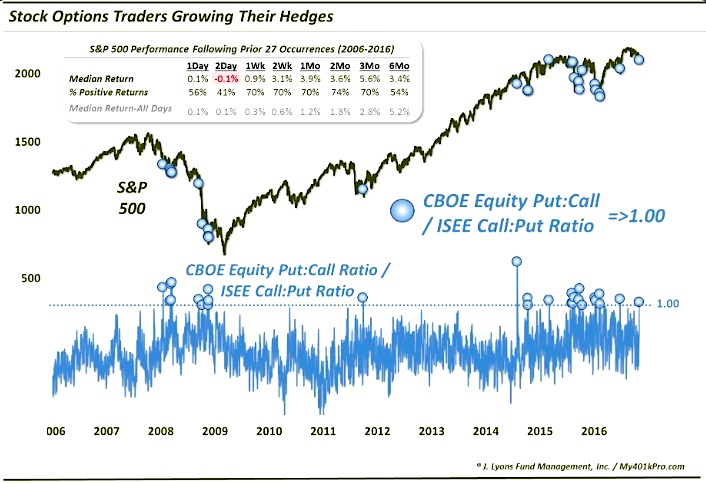
So what are the implications of this elevated level of hedging on the 2 exchanges? Is it necessarily a buy signal based on the contrarian concept? For the most part, yes. However, like Tuesday’s post on the ramp in volatility expectations, the contrarian behavior doesn’t always kick in immediately. It’s certainly not uncommon for selling pressure to continue in the days following readings of 1 or higher. However, after a week, most occurrences have led to consistently positive and above-average returns.
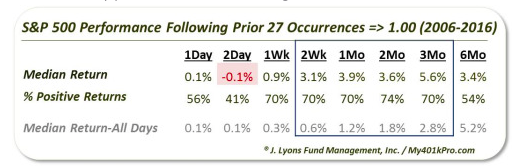
As the table indicates, the 2-week to 3-month time frame is really the contrarian sweet spot for this indicator. The S&P 500 was higher more than two thirds to three quarters of the time over those durations. And the median returns were much higher than typical.
Now, we don’t like to cherry-pick, but the results would be considerably better without the handful of incidents in August 2015 in the lead-up to the market rout. Without those dates, the 2-week to 2-month returns would be at more than 80% positive with a median return of more than 6% by the 2-week mark. However, we cannot simply dismiss those samples because they don’t agree with the others. That period taught investors a valuable lesson that so-called contrarian buy signals do not always revert before further serious damage.
Lastly, what of the proliferation of readings over 1.00 since 2014? Has this indicator been diluted due to the large increase in such readings. Perhaps a little. However, many of the signals took place in the midst of the market carnage during last summer and early this year. Therefore, the environment was unlike what we had seen for a long time and, thus, likely warranted the increase in readings. However, we will say that the ISEE indicator has been acting a little flaky in recent months, i.e., giving odd readings relative to the market action. That has at least somewhat tempered our confidence in this indicator.
On the whole, however, this has historically been a decent barometer of investor fear. So whether or not a market bottom is imminent, we can at least say with confidence that the exuberant or complacent condition that described investor sentiment a couple months ago has been largely unwound.
Thanks for reading.
You can read more from Dana on his blog.
Twitter: @JLyonsFundMgmt
The author does not have a position in mentioned securities at the time of publication. Any opinions expressed herein are solely those of the author, and do not in any way represent the views or opinions of any other person or entity.
 Rolling Over At Key Fibonacci Level?")


