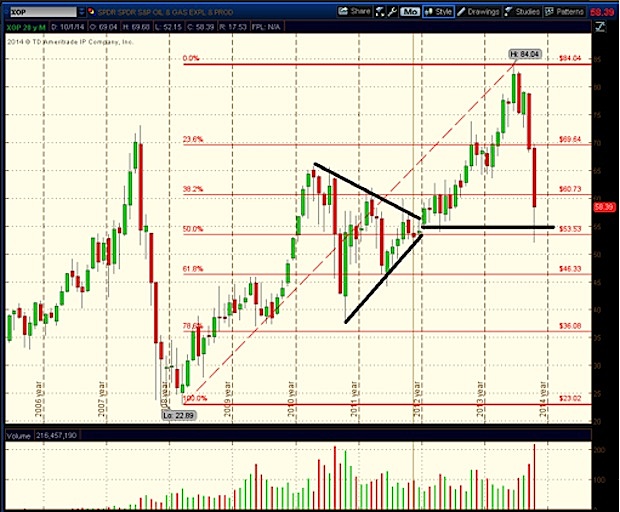
The Oil and Gas ETF (XOP) suffered a tremendous decline from the 2014 all-time high at $84. In sum, XOP retraced 50% of the move from $23 to $84 from the bear market low in 2009 to its peak in 2014. The precise 50% retracement level is $53.53. Technicians like to find a confluence of technical significance when identifying support and resistance.
And with this in mind, we can see that XOP has another converging point of support from the symmetrical triangle that formed from 2011 to the end of 2012. The apex of the triangle is thought to be supportive, which coincides with the 50% retracement level near $54.
XOP declined in a dramatic fashion in the last several months to this support zone in the low-mid 50s, so this will remain an important price area to watch.
Oil and Gas ETF (XOP) Monthly Chart
Shifting to a more near-term chart of XOP, we see the sharp decline in the last few weeks. As well, volume intensified throughout the week. On October 15, XOP printed a bullish engulfing candlestick which was confirmed into October 16 (as of this writing). A bullish engulfing candlestick main concern is with the ‘real body’ of the candle, not the wicks. The real body is the area between the open and the close. XOP had been finding support at the 200 day moving average since the beginning of 2013 before falling below it in September. Since the 200 dma had been support for the Oil and Gas ETF, the expectation is for XOP to now find it as resistance.
XOP Daily Chart
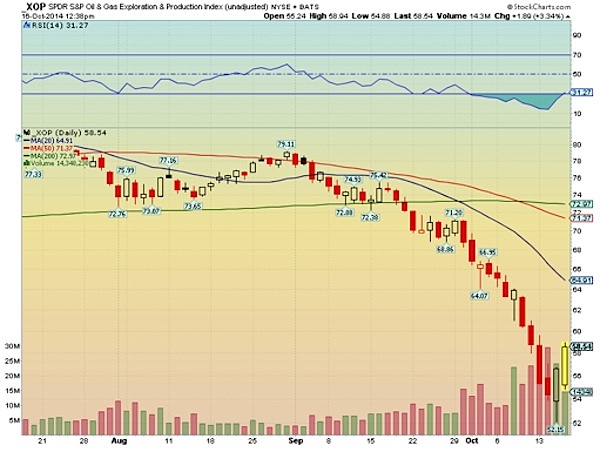
I like to always look for what could go wrong in an analysis. You could call this the ‘fear’ section. What is of concern is the 200dma turning negative, while the shorter term 20 and 50 day moving averages are decidedly in decline. This suggests the overall trend is down, but this is often the case at initially bullish inflections. Broader intermarket concerns would be a rising US Dollar pressuring WTI Crude Oil. The US Dollar has paused from its massive rally from May through September. Seasonally, crude tends to bottom near year end, and again dipping in February.
Given the longer-term confluence at the $53-54 level as well as the recent confirmed bullish engulfing candle, XOP presents an interesting play on a pause in or reversal of the decline of the energy sector. Keep an eye on this oil and gas etf. Thanks for reading.
Follow Mike on Twitter: @MikeZaccardi
No position in any of the mentioned securities at the time of publication. Any opinions expressed herein are solely those of the author, and do not in any way represent the views or opinions of any other person or entity.

: Worrisome to Broader Market?")

