The following is a recap of the October 28 Commitment Of Traders (COT Report) released by the CFTC (Commodity Futures Trading Commission) looking at COT data and futures positions of non-commercial holdings as of October 25.
Note that the change in COT report data is week-over-week. Excerpts of this blog post originally appeared on Paban’s blog.
Crude Oil
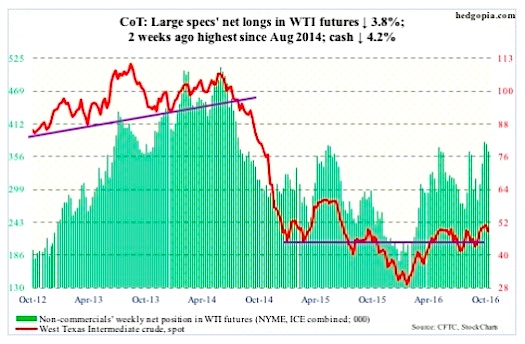
In the weekly EIA report, the inventory data was favorable but crude oil prices were unable to rally, with spot West Texas Intermediate crude dropping 1.6 percent on Wednesday.
Earlier on Sunday, Iraq said it does not want to join OPEC output cut, if there is one, which will be decided at its November 30th meeting. Iraq said it currently produced 4.77 million barrels per day, of which 3.87 mb/d was exported. The Iraqi news already put oil under pressure. Then there were technicals.
Since the February lows, spot WTI crude oil has been making higher lows, and would have been an interesting development had it convincingly pushed past the June 9th high of $51.67 for higher highs. On October 19, spot crude oil prices did rise to $52.22 but the momentum did not last very long. Weekly momentum indicators are now coming under pressure. The February trend line comes up for a retest around $46.
In the week through October 21, crude stocks fell by 553,000 barrels to 468.2 million barrels. This was the lowest since January 22 this year. Crude oil stocks have dropped by 27.1 million barrels in the last eight weeks.
Gasoline stocks dropped by two million barrels to 226 million barrels, and distillate stocks by 3.4 million barrels to 152.4 million barrels – an 11-week low.
Crude imports, on the other hand, rose by 109,000 b/d to seven mb/d. The prior week was the lowest since June 19, 2015.
Crude oil production increased by 40,000 b/d to 8.5 mb/d – a five-week high. Production peaked at 9.61 mb/d in the June 5th week last year.
And refinery utilization inched up six-tenths of a point to 85.6. The prior week was the lowest since April 26, 2013.
October 28 Commitment of Traders: Currently net long 363.9k, down 14.5k.
Gold
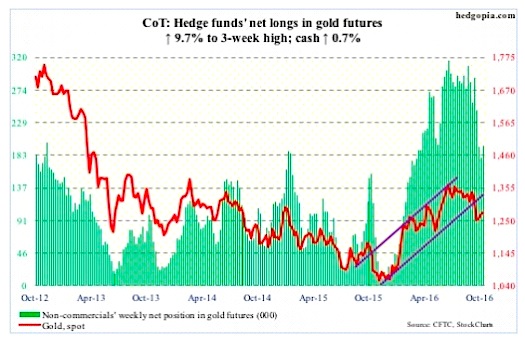
After the 3.3-percent October 4th drop through $1,300 support, spot gold prices have pretty much traded around its 200-day moving average ($1,269). Gold has been on slight uptrend since October 7, but has been unable to substantially lift off of the average, which, unlike the 50-day moving average, is still rising.
Flows are not cooperating. In the week ended Wednesday, the SPDR Gold ETF (NYSEARCA:GLD), lost $1 billion. This followed $791 million in inflows in the prior couple of weeks (courtesy of ETF.com).
Non-commercial traders, who have cut back from the all-time high 315,963 contracts as of July 5, 2016 to last week’s 179,618, added some gold this week.
October 28 Commitment of Traders: Currently net long 197k, up 17.4k.
US Dollar Index
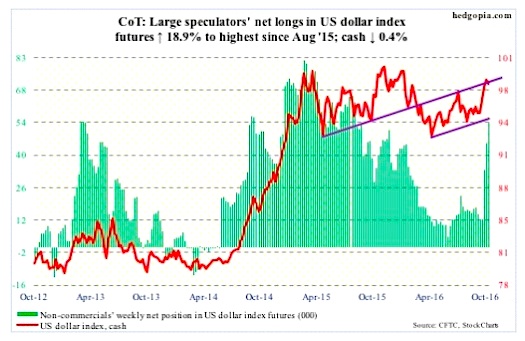
Since the early-May (2016) low, the US Dollar Index has been trading within an ascending channel, the upper end of which is currently being tested.
The US Dollar index remains grossly overbought particularly on a daily and weekly basis. Unwinding of these conditions is just a matter of time. This week probably begins that process.
In a larger scheme of things, the US Dollar (rose to 99.09 on Tuesday, closing the week at 98.22) continues to trade within $100-plus and $93-plus. As is, it is hard to imagine a break to the upside anytime soon.
October 28 Commitment of Traders: Currently net long 54k, up 8.6k.
E-mini S&P 500
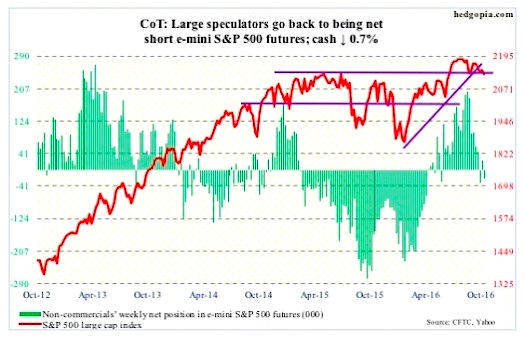
The rising trend line from February this year on the S&P 500 (cash) has been slightly breached, with a failed backtest this week. The 50-day moving average continues to drop. The SPDR S&P 500 ETF (NYSEARCA:SPY), was repelled right at that average on Monday.
For the most part, post-earnings stock reactions have not been good, partly because of poor outlook and partly because stocks have had a great run into earnings. The October 13th low of 2115 – or horizontal support at 2120 – continues to be the line in the sand. The latter was tested on Friday.
In the week ended Wednesday, a whopping $16.6 billion came out of U.S.-based equity funds (courtesy of Lipper).
In the same week, SPY attracted $1.3 billion. This followed redemptions of $2 billion in the prior two (courtesy of ETF.com).
October 28 Commitment of Traders: Currently net short 21.5k, down 44.5k.
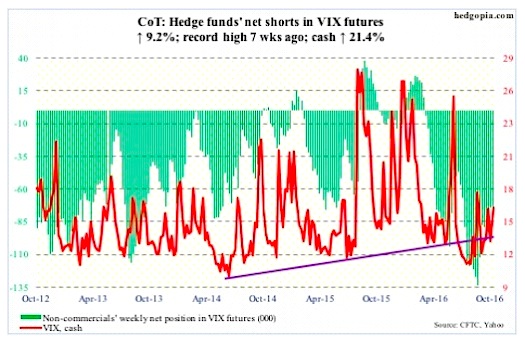
VIX Volatility Index
On Friday last week, spot VIX Volatility Index lost the 50-day moving average, but a subsequent test this Tuesday of the August 9th rising trend line was successful, as VIX dropped to 12.73. At 16.19, it is now back above that average, as well as the 200-day – albeit barely on the latter.
Intra-day Monday, the VIX-to-VXV ratio dropped to .834 before rising. The week closed at .93, and there is still some room for it to push higher.
October 28 Commitment of Traders: Currently net short 81.5k, up 6.9k.
Thanks for reading.
Twitter: @hedgopia
Author may hold a position in mentioned securities at the time of publication. Any opinions expressed herein are solely those of the author, and do not in any way represent the views or opinions of any other person or entity.


 Testing Important Price Support")


