Nvidia has captured the technology investor community by storm.
Nvidia’s stock price (ticker: NVDA) has surged in recent weeks and this has lead the broader stock market higher!
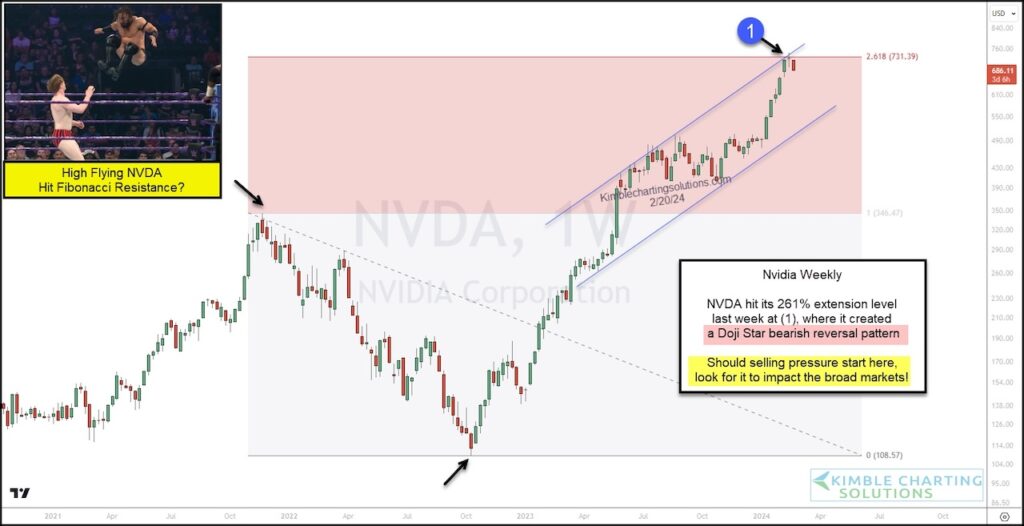
But, as you can see on today’s “weekly” chart of Nvidia, the high flying NVDA hit its 261% Fibonacci extension level last week, where it created a bearish doji star pattern at (1).
Recent weakness has me concerned that any further selling might trigger a broader stock market correction. Stay tuned!
$NVDA Nvidia “weekly” Stock Chart
Note that KimbleCharting is offering a 2 week Free trial to See It Market readers. Just send me an email to services@kimblechartingsolutions.com for details to get set up.
Twitter: @KimbleCharting
The author may have a position in mentioned securities. Any opinions expressed herein are solely those of the author, and do not in any way represent the views or opinions of any other person or entity.

: Worrisome to Broader Market?")

