In the early April, the already months-long rally underway in the Japanese Nikkei225 as a result of Japanese PM Abe’s fiscal stimulus entered its second phase as newly-appointed Bank of Japan Governor Kuroda unveiled an “unprecedented” QE program that exceeded already lofty market expectations. It’s far too early to tell if Abe and Kuroda will achieve their goal of prying the Japanese economy from a decade’s long deflationary deathgrip. However, markets haven’t wasted any time affirming and reaffirming their optimism with daily fervor.
How much fervor? The benchmark Japanese equity index is up 75% since former PM Noda dissolved parliament in mid-November. This move called for new elections, making the way for Abe’s (re)accession, borne forward tailwinds of aggressive pro-growth messaging.
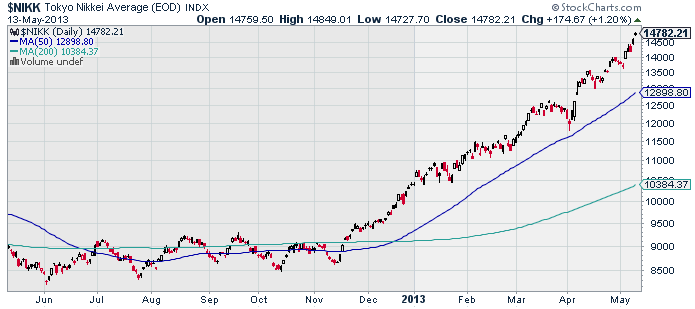
The only meaningful dip in those 6 months since? A 5% correction in the latter part of March on some mean-reverting repositioning prior to the much-anticipated reveal of the BOJ’s new monetary policy program, settling with a hammer at 12000 during April’s first session. That policy reveal came April 4th. As you can see, Governor’s Kuroda’s commitment to stimulating 2% inflation by doubling Japan’s monetary base by year-end 2014 was well received. Japanese markets have lost no enthusiasm in the month since.
If “75% in 6 months” sounds like the stuff of snake oil and penny stock newsletters, you’re right feel an alternating sense of wonder and skepticism. This kind of a move is perhaps credible on a individual high-beta momentum stock: even a commodity with an exceptional fundamental catalyst behind it. But a broad-base index in the world’s third largest economy? Surely something has to give.
Throw your favorite momentum oscillator over the Nikkei: it will register heavily overbought on any timeframe. Here’s the chart above again, this time on a weekly timeframe with RSI plotted beneath:
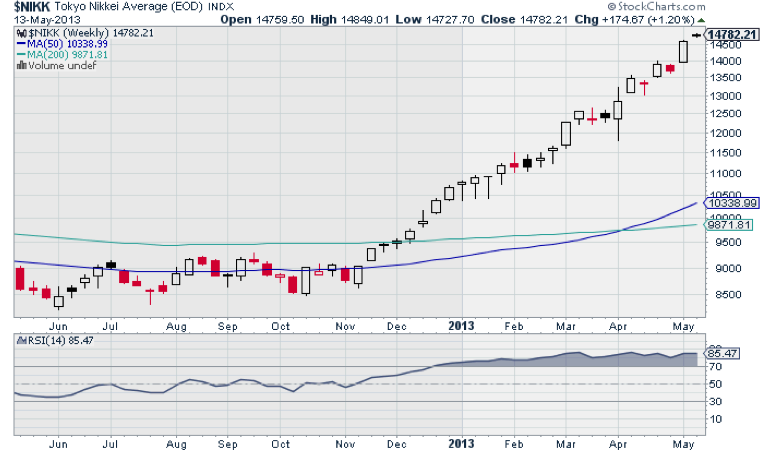
85.47? Heavily overbought? How about ridiculously overbought?
But, in the same glance, you’ll note this condition has prevailed since mid-December: in fact, the Nikkei has persisted above 80 since latter February. Now, take a look at late-February to see how shorting into that overbought signal has fared since.
At this point, you can – rightly expect – the usual caveats: 1) “overbought” (in the case of RSI, that is defined as a reading”>70″) can lost an uncomfortably (even fatally) long time; 2) the Nikkei can continue to go up; and of course 3) as overbought as it is, a correction could occur at any time.
Those are the usual caveats because they’re true: and I include them here because a periodic reminder of these market truisms – especially when the Nikkei and the Japanese Yen are being so closely watched as complementary barometers of the global risk trade – is never entirely redundant.
Until the Nikkei convincingly breaks down, even on top of a 75% rally the direction to take trades in is indisputably up. With government measures more intensive than any in living memory, some may be tempted to claim technicals cease to matter. On the contrary, they matter as much as ever: not only will they keep you on the right side of price, but on the right side of the Japanese government’s endeavors (which, as we’ve seen, are well-aligned)!
Not all price levels are created equal, however. In the following chart, harmonic pattern analysis is applied to the index to discern where the next major price milestones and potential resistance rungs come into play. The current context is one of expansive fiscal policy and a QE program that will not slow down any time soon. Given that overall backdrop, short-term dips notwithstanding the Nikkei suggests it has plenty of room to move (click image to zoom):
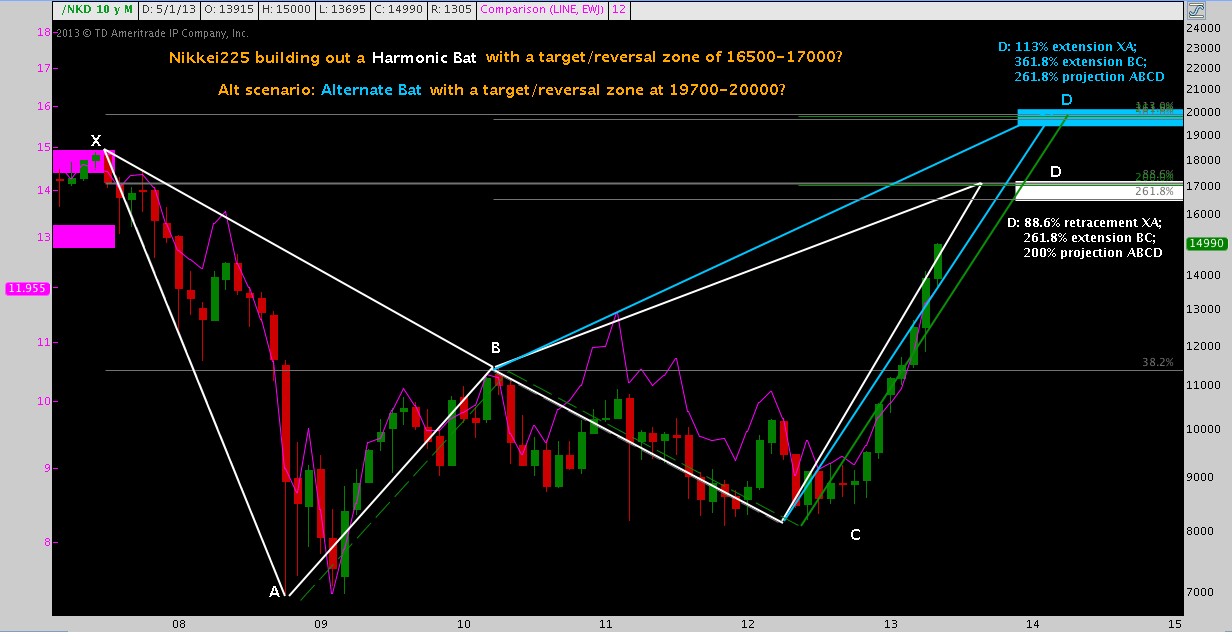
note: On the left axis I’ve included EWJ; purple rectangles on left are correlated Bat and Alt Bat target/reversal zones
Twitter: @andrewunknown and @seeitmarket
Author holds no position in any securities mentioned at the time of publication.
Any opinions expressed herein are solely those of the author, and do not in any way represent the views or opinions of any other person or entity.


