Persistent inflation has dogged the Federal Reserve for the past 12-18 months, leading to higher interest rates.
But rates have fallen more recently as investors build a narrative around falling prices and the potential for rate cuts.
Well, I’ll be the first to tell you that I don’t think inflation is going away just yet. With the prospect of international war, renewed gulf issues, china reopening and summer driving season, I think we are just getting a pause/pullback.
That said, the proof will be in the pudding. Today, we look at the chart of the long-dated treasury bond etf (TLT) and discuss key technical price levels to watch.
Note that the following MarketSmith charts are built with Investors Business Daily’s product suite.
I am an Investors Business Daily (IBD) partner and promote the use of their products. The entire platform offers a good mix of tools, education, and technical and fundamental data.
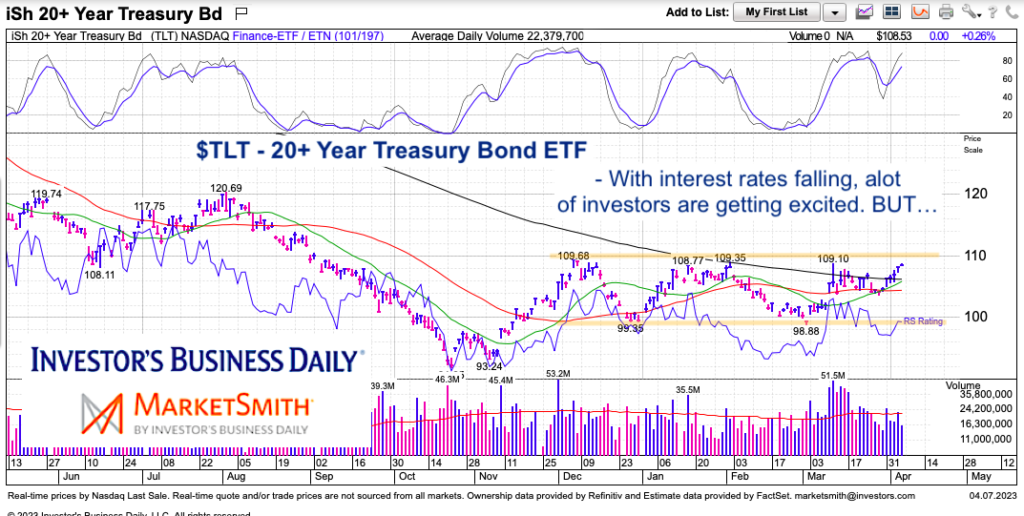
$TLT 20+ Year Treasury Bond ETF Chart
Should TLT breakout above $110, then we must consider this 6 month pause to be something longer (maybe 8-9 months). The next resistance level above $110 is $120.
But, if crude oil moves higher, which i expect it to eventually do (perhaps to $125-$150 by 2024), then I would think agriculture (corn, wheat, soybeans) will likely follow suit.
Enough of my opinions… let’s watch $110 and perhaps $120 near-term and see how TLT reacts. A move below $99 may signal a test of the lows and a new cycle higher in interest rates.
Twitter: @andrewnyquist
The author may have a position in mentioned securities at the time of publication. Any opinions expressed herein are solely those of the author, and do not in any way represent the views or opinions of any other person or entity.

: Showing Some Signs of Emerging Strength")
