Dow Theory is the concept that Charles Dow created in the early 20th century.
It basically looks at two main parts of the economy and sees whether or not they are in agreement about the direction of the economy.
I usually refer to a “New Dow Theory” which uses indexes that better reflect the current market structure, and this chart is nearing a major bullish signal.
Charles Dow would look at the Dow Industrials versus the Dow Railroads and see how they were moving relative to each other.
The Industrials represented the producers of goods, and the Railroads would be the distributors of goods. The general idea was if the producers and the distributors were both doing well, then the economy was good and the markets were good.
If one of them was not doing well, it implied an imbalance of sorts, suggesting there was some underlying weakness that wasn’t yet reflected in the overall price.
The problem is the Dow Industrials index now includes things like big banks, service companies, and technology companies. The Dow Transports isn’t just railroads, it includes airlines and other companies that don’t really have very much to do with distributing goods.
So that general concept, while I still follow it, is kind of broken in terms of being a reflection of what Charles Dow had in mind.
What I follow now is called the New Dow Theory. It basically breaks the economy into two parts: the S&P 500 (top panel), and the Nasdaq Composite index (bottom panel). The markets are no longer driven by big industrial conglomerates and transportation stocks that distribute their goods, but instead are broken into the “old economy” and the “new economy”. Hence, our “new” dow theory.
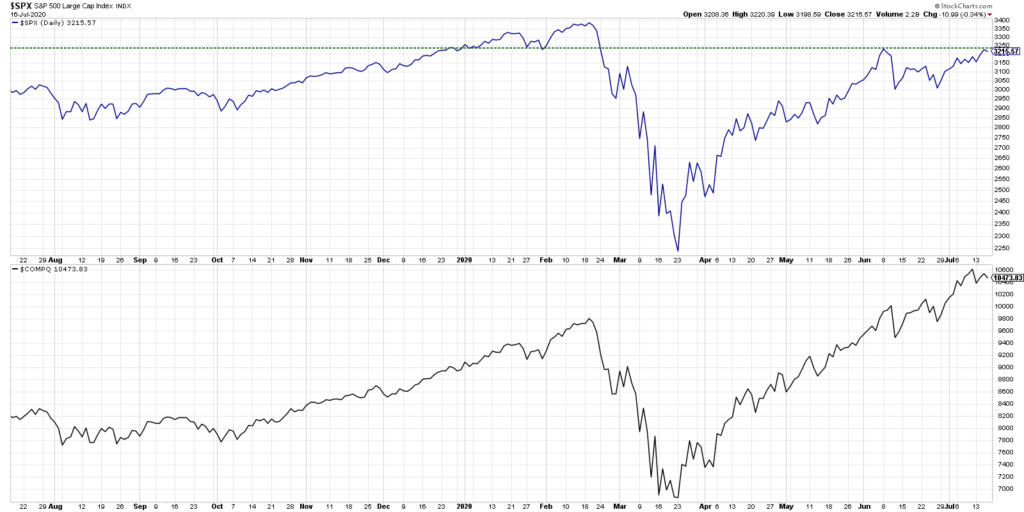
The old economy, represented by the S&P 500, includes financials and consumer stocks, as well as industrials, basic materials and so forth. The Nasdaq Composite really focuses on the technology side and embraces the fact that technology has a fairly significant, central role in the functioning of our modern economy.
The general idea is that if these two indexes are both making higher highs and are both breaking above resistance, then overall the conclusion is positive. However, if they are breaking to new lows like they did in February/March 2020 and are both breaking to a new swing low, that suggests confirmation of downside as they are confirming a breakdown of previous support.
When one of them does not confirm the other, we call this a “non-confirmation”, and that is why this chart is so relevant today. The Nasdaq Composite, as we know, has already broken above its February high. It’s continued to make a pattern of higher highs and higher lows, even including this week’s pullback in the FANG names. Overall the long-term trend out of the March lows has remained very positive.
If you look at the S&P 500, overall the trend has remained positive. But while the Nasdaq Composite has already broken above its high from the second week in June, the S&P 500 has not quite done that yet. So on a closing basis it’s bumping up against that peak from the first week in June which is around 3230 or 3240.
My conclusion is this: if the S&P 500 is able to break above 3250, which would put it above the June highs as the Nasdaq Composite remains in an uptrend, overall that suggests further upside. I would expect the S&P to retest 3400 if not even further, and overall the trend would be quite positive.
If, however, the S&P fails here and pulls back in a meaningful way, this points to a non-confirmation, with the technology heavy Nasdaq composite moving higher but the traditional companies comprised by the S&P 500 unable to eclipse that previous high.
This is my One Chart for today because it illustrates a potential non-confirmation in what I call “New Dow Theory”, the S&P 500 versus the Nasdaq Composite, or the old economy versus the new economy. I’m looking to see if the S&P is able to eclipse its previous high and break above 3250, which would suggest much greater potential for further upside.
To watch this in video format, just head over to my YouTube channel!
Twitter: @DKellerCMT
The author does not have a position in mentioned securities at the time of publication. Any opinions expressed herein are solely those of the author, and do not in any way represent the views or opinions of any other person or entity.

: Showing Some Signs of Emerging Strength")

