The misery for Netflix’s stock price began late last year… but wow, has 2022 (April!) been bad for the stock (NFLX).
The stock price has fallen from $700 to $200 in less than a year. Yikes!!
Today, we won’t advocate for catching a falling knife. But we will look at a long-term chart to highlight where NFLX may find some support, if only for a bounce.
Note that the chart below is a very long-term, fuzzy trend picture… Traders with heavy risk appetites and extreme discipline would need to zoom in on a near-term chart (at the right time) to develop a strategy.
Note that the following MarketSmith charts are built with Investors Business Daily’s product suite.
I am an Investors Business Daily (IBD) partner and promote the use of their products. The entire platform offers a good mix of analysts, education, and technical and fundamental data.
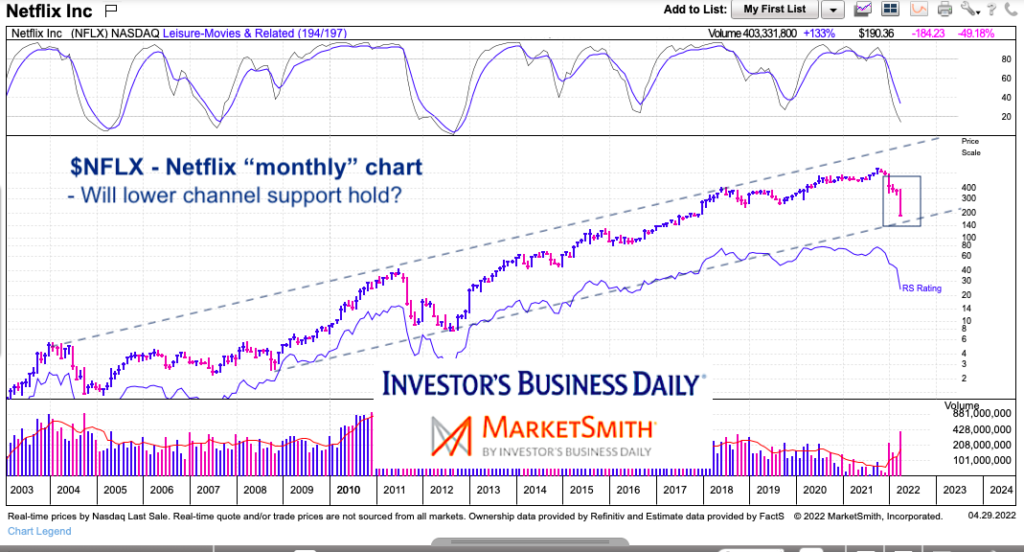
$NFLX Netflix “monthly” Stock Chart
Below is the monthly chart of Netflix stock. I highlighted the long-term rising trend channel. Price has fallen to the lower end of the channel. Could this be where price finds some support? If so, that comes in around $150-$170. Again, near-term charts and indicators would dictate any trade ideas. I know nothing about Netflix fundamentals and long-term vision, but perhaps value investors who still believe in the company could emerge.
Twitter: @andrewnyquist
The author may have a position in mentioned securities at the time of publication. Any opinions expressed herein are solely those of the author, and do not in any way represent the views or opinions of any other person or entity.
Editor’s Note (May 3, 2022 at 3:16pm CST): deleted an apostrophe from title.


