Netflix (NFLX) has been one of the hottest large-cap tech stocks of 2018.
As of yesterday, Netflix stock is up over 60 percent year-to-date… and this includes February’s market swoon!
This mo-mo darling is nearing a crossroads, though.
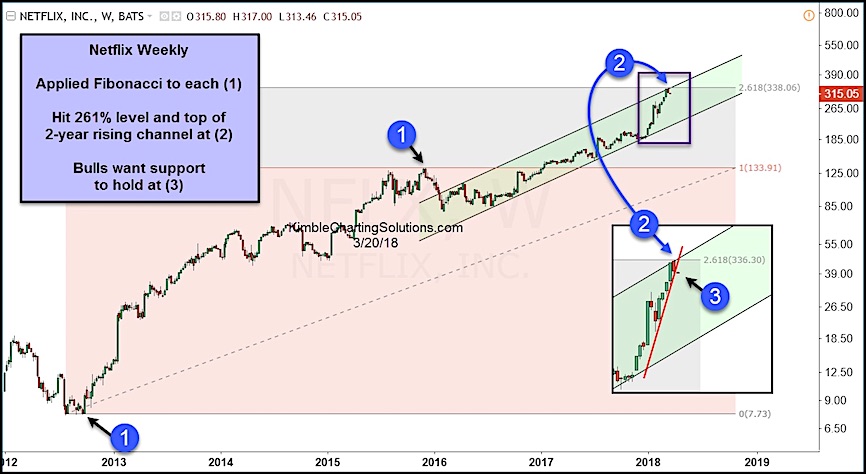
Early last week, NFLX tested a confluence of resistance that included the topside of its bullish rising channel and its 261% Fibonacci extension level (both at point 2). That’s formidable resistance! As expected, the stock reversed lower and has pulled back from there.
What happens next will be important. A rally that breaks out above resistance would keep Netflix stock in a bullish near-term stance. However, if NFLX continues to pullback and breaks below its rising trend line (point 3), that would set the stage for a deeper decline. Should this occur, NFLX may retest the January highs, or even its lower channel support further below.
Stay tuned!
$NFLX Netflix ‘Weekly’ Stock Chart
Note that KimbleCharting is offering a 30 day Free trial to See It Market readers. Just send me an email to services@kimblechartingsolutions.com for details to get set up.
Twitter: @KimbleCharting
Any opinions expressed herein are solely those of the author, and do not in any way represent the views or opinions of any other person or entity.


