You won’t find many liquid, multi-hundred-dollar household-name stocks exhibiting spectacular rise-to-fall moves in this market; but this today’s reversal bracketing Netflix earnings (NFLX) certainly met that description.
Q3 earnings were released just after Monday’s close and were warmly received (to say the least) initially. The 4:00 p.m. release was preceded by a steady session of unwavering bullish fervor: from the gap-up at the open to a close fractionally off the day’s highs, Netflix added +6.4% yesterday pre-earnings.
Then, within seconds of the release, NFLX shares jumped over $40; climbing as high as $396.98 in the first post-report minute of extended hours trade. The session would finish 4 hours later at $394.99 – up exactly $40 or +14% over the $354.99 normal session close.
Netflix (NFLX) – 1-Minute – Can You Spot the Earnings Candle?
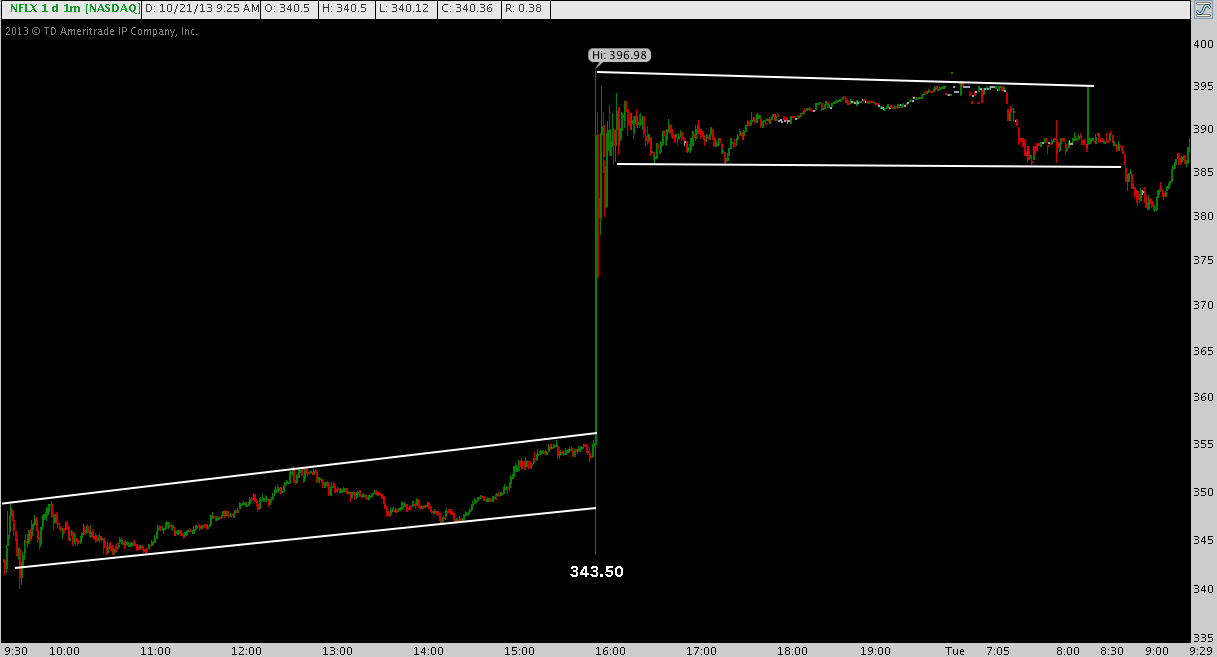
Netflix emerged from this morning’s pre-market trade off modestly to just shy of $388 but still inside overnight post-earnings range. Today’s daily candle effectively recaps what then occurred following the open:
Netflix (NFLX) – Daily: Netflix Earnings Produce a Bearish Engulfing
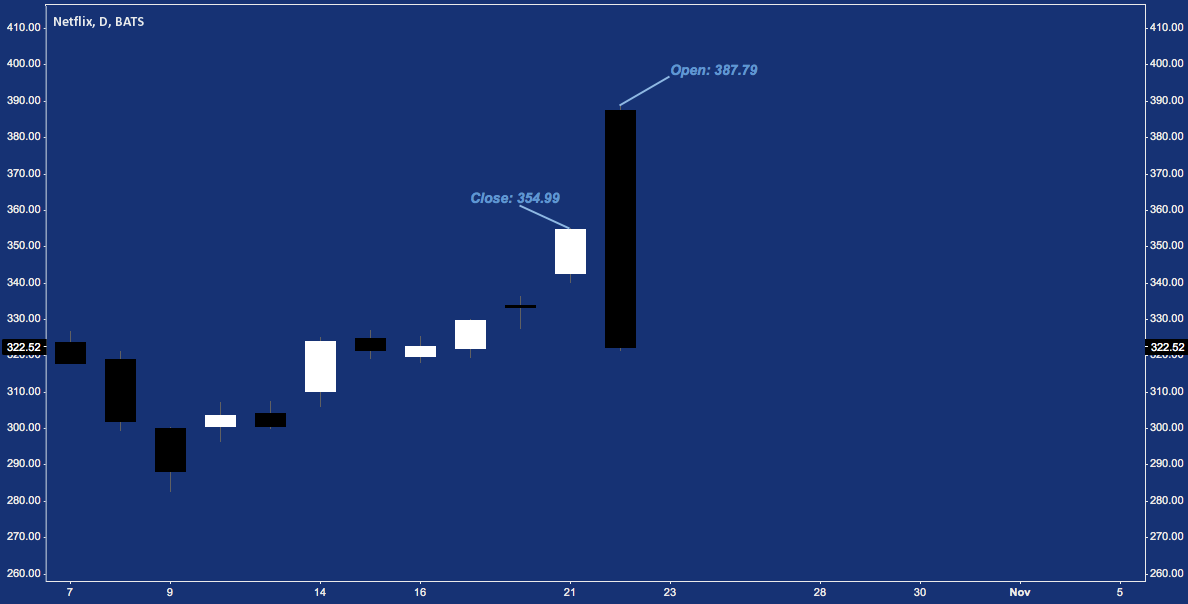
Altogether, yesterday and today’s volatile activity make up a commonly-occurring pattern known in candlestick parlance as a Bearish Engulfing.
The Bearish Engulfing pattern is comprised of two candles:
- Candle 1 is a white (up) candle of any kind.
- Candle 2 is a black (down) candle where the open occurs higher than the close of Candle 1, and the close occurs lower than the open of Candle 1. In short, Candle 2‘s body engulfs the body of Candle 1.
A couple basic notes on identification:
- Disregard wicks/shadows. They are important, but irrelevant to identification of the Bearish Engulfing.
- Candle 1’s body may be large or small: its identity – doji, spinning top, marubozu – is also unimportant.
Seems simple enough; and indeed, the Bearish Engulfing (along with its mirror image, the Bullish Engulfing) is a very straightforward two-candle pattern that looks and acts just as its name suggests.
Be that as it may, let’s break the pattern down to investigate its underlying mechanics.
- Candle 1 Occurs in (or is) an Up-Trend. However long the trend may be, Candle 1 represents the terminus of a local up-trend. As a result, it carries positive sentiment with it into the close on the first day of the pattern.
- Candle 2 opens Gap-Up, Above Candle 1’s C;ose. In equity markets, Bearish Engulfing patterns occur because additional bullish price movement during extended trading hours. This movement outside normal trading hours accounts for the disparity between Candle 1’s closing and Candle 2’s opening prices, resulting in a gap. Observe above where Monday’s pre-earnings candle closed at $354.99, whereas Tuesday’s post-earnings candle opened dramatically higher than the previous close.
- Candle 2 Closes Below Candle 1’s Open. Candle 2 can and often does initially trade higher once the normal session begins, continuing the bullish push of the previous day and preceding extended hours session. Whether this occurs or not, this ebullient sentiment completely fizzles as the session wears on. By the end, Candle 2 will trade below and ultimately close below where Candle 1 opened, marking – at least for that session – a complete role reversal in which the bear wrest decisive control from the bulls. Candle 2 may close off (sometimes well off) its session low, leaving a wick beneath it. The hint this gives about a possible late day rally is important, but whatever the presence or size of a wick, a close beneath Candle 1’s open locks in the pattern as a Bearish Engulfing.
These underlying criteria add up to this:
Key Points to Remember:
Trend: Bearish Engulfing patterns are always preceded by a rising trend. Theoreticians may differ on what constitutes a “trend” here; but in my experience, a single up candle is enough.
Reversal: The Bearish Engulfing is a quintessential reversal pattern: The opening/closing range on Candle 2 completely envelops Candle 1, entirely negating the bullish effort denoted by it. Depending on the size of the white candle, this bullish effort may have been modest – as in the case of a doji – or massive and seemingly decisive.
Outcome: the Bearish Engulfing may begin a very short-term bearish reversal, a protracted decline; or negated itself by a gap-up or rally during the session following Candle 2. As Thom Bulkowski notes, Bearish Engulfing patterns culminate in a downward breakout (i.e. the session following Candle 2 closes lower) 79% of the time.
Sentiment: Much can be discerned from studying what Candle 2 does (and doesn’t) engulf. Whether Candle 1 is big or small and its wicks are all important to observe: what is engulfed explains the negative sentimental impact underway as much as the candle doing the engulfing, if not more so.
Perhaps most importantly:
Context: pattern identification is simple enough – it can be done entirely without reference to a living, breathing market (as textbook archetypes prove). Assessing the relative worth and probable consequences of a candlestick pattern is more difficult to do well; but it begins with looking at the pattern’s context.
There is no comprehensive checklist to determine context; but in the case of the Bearish Engulfing, a few questions to ask are:
- Are multiple candles involved?
- Are gaps-up closed?
- Are major levels of horizontal support (perhaps previous resistance in the rising trend leading to the pattern) broken through?
- How about major fibonacci retracements/pivot points/moving averages/a lower Bollinger Band?
- Does major horizontal or trend line support reside just below the possible “confirming” downward breakout?
- What is the relative volume relationship between Candles 1 and 2?
- What larger patterns or price relationships (e.g. is this occurring outside an upper Bollinger Band or at key resistance?) is this Bearish Engulfing potentially involved in that will figure in formulating risk management parameters for a trade?
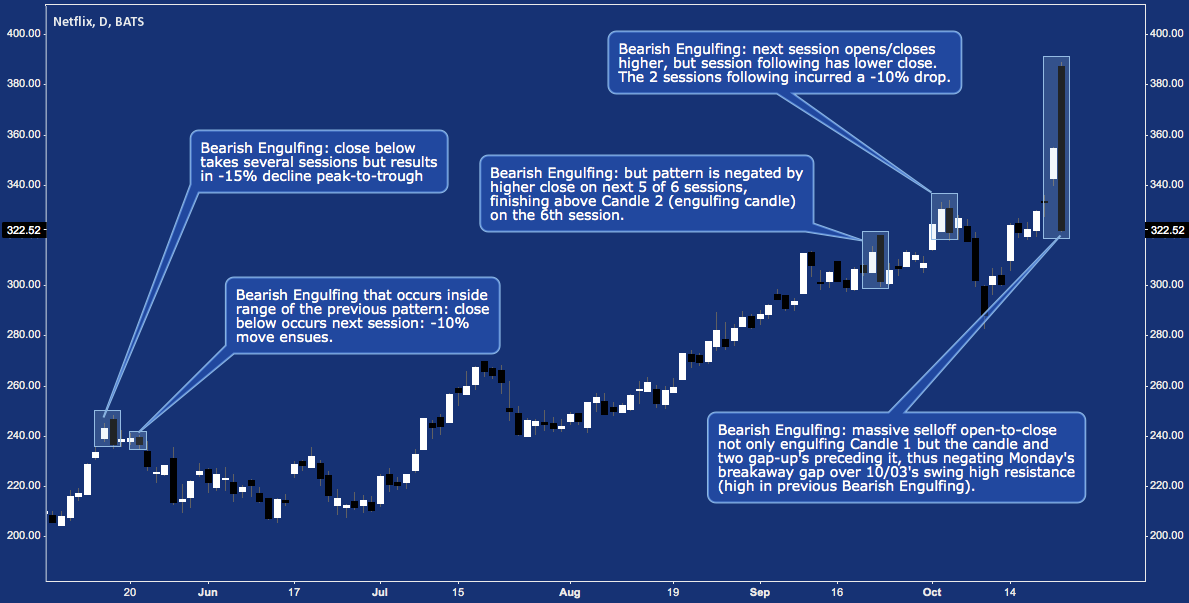
Below is current daily chart for Netflix, featuring the monstrous pattern-in-the-making along with a few nearby Bearish Engulfing, each with its own context and as a group indicative of the pattern’s possible outcomes.
Netflix (NFLX) – Daily: Netflix Earnings and Four Other Bearish Engulfing Patterns (click image to zoom)
Twitter: @andrewunknown and @seeitmarket
Author holds net short exposure in NFLX at the time of publication.
Any opinions expressed herein are solely those of the author, and do not in any way represent the views or opinions of any other person or entity.


: Showing Some Signs of Emerging Strength")
