Inflation is felt the most with food and energy. Today we look at the latter, focusing on rising natural gas prices.
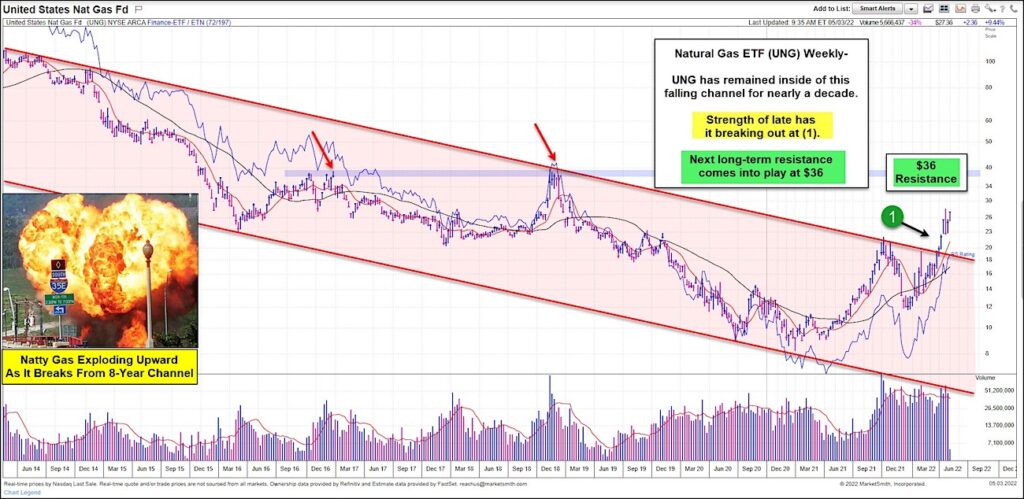
In particular, we look at the “weekly” chart of the United States Natural Gas Fund ETF (UNG). And, as you can see, prices are exploding higher.
The rise over the past two years has been strong. And this strength has price breaking out of an 8-year falling channel at (1).
This has created a vacuum in which price can rally all the way up to resistance at $36. This resistance comes into play at the two prior peaks.
Will momentum carry price there in short order? Natty gas is red-hot! Stay tuned!
U.S. Natural Gas Fund ETF “weekly” Chart
Note that KimbleCharting is offering a 2 week Free trial to See It Market readers. Just send me an email to services@kimblechartingsolutions.com for details to get set up.
Twitter: @KimbleCharting
Any opinions expressed herein are solely those of the author, and do not in any way represent the views or opinions of any other person or entity.

: Worrisome to Broader Market?")
