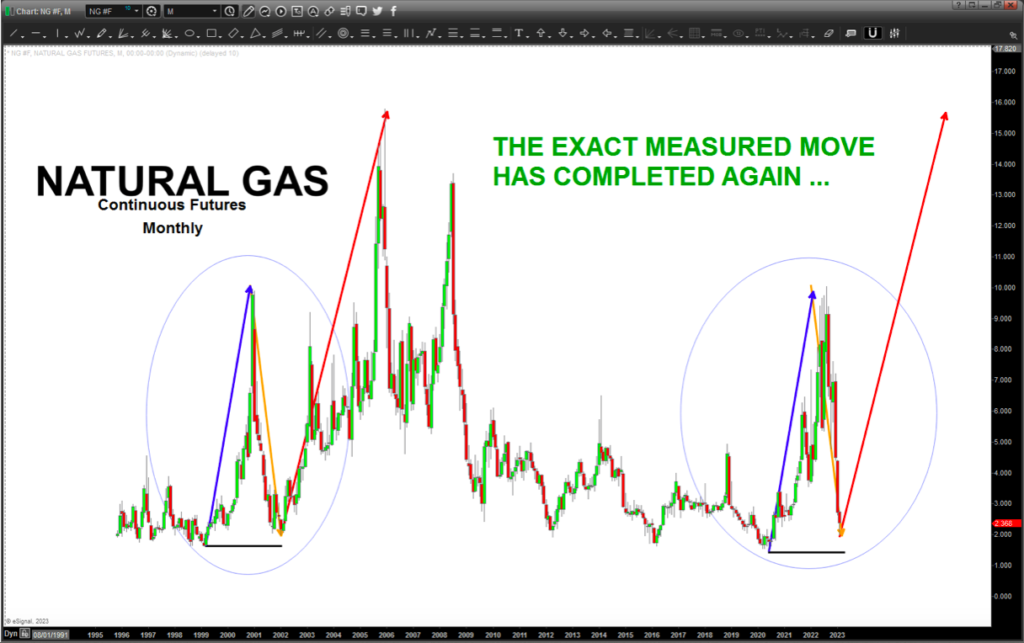
Recently I posted the “measured move” on the Continuous Contract for Natural Gas Futures from a monthly scale. Here is the link.
In my opinion, Measured Moves are the most underutilized YET most POWERFUL tool in our toolbox. I think people don’t use them because they clutter their charts w/ lagging, coincident indicators like moving averages, bollinger bands, oscillators, and 1000’s of other tools. Do these tools work? SURE… but, just think about it, ALL of the techniques and tools we use as chartists (even the esoteric stuff) is all contained in what? THE MEASURED MOVE.
This measured move is so nice BECAUSE it’s EXACT in both PRICE and TIME.
Add that to the count shown and the PATTERN present we have a very high probability trade. Right now, we are only risking a dollar. Trust me, we have time get into this move but the longer you wait, the more your risk will increase.
Other “proxies” are showing amazing measured move synergy … in this case, from a percentage perspective using log scale.
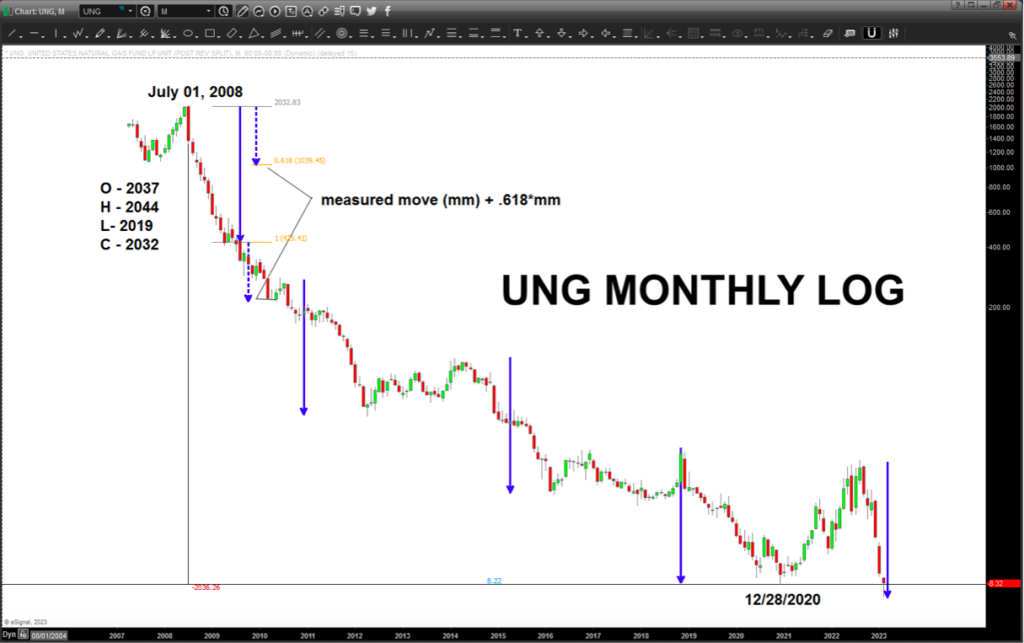
note, added the measured move (mm) + .618*mm to equal first leg down
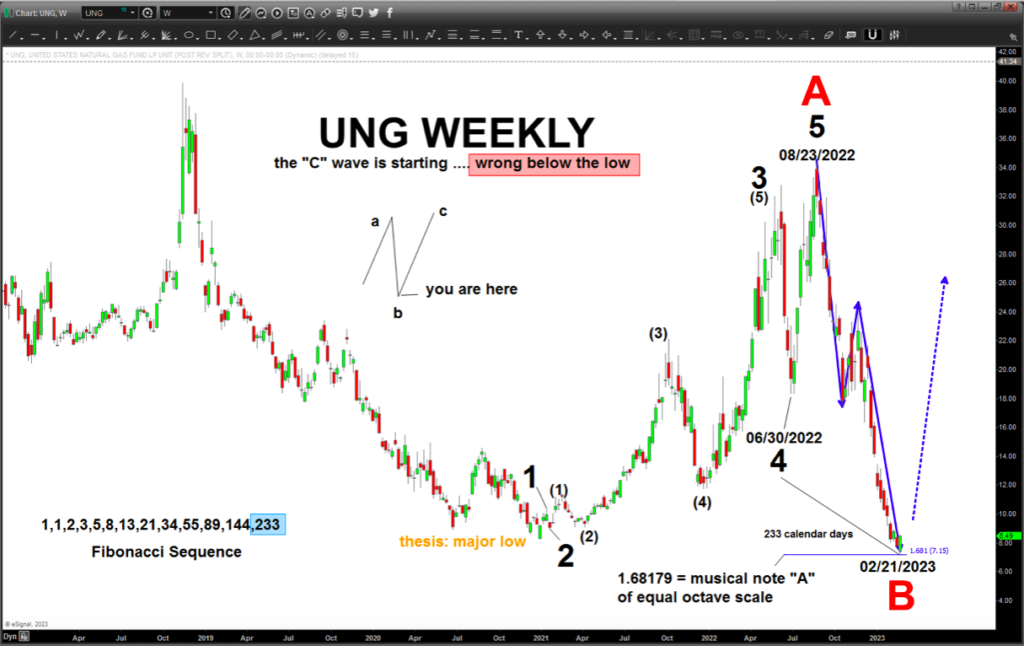
Here is the “final” count I’m going w/ in regard to UNG.
The analysis below will be proved wrong (and would stop out this idea) with a WEEKLY close below 7.00 on $UNG (weekly chart below).
Let’s add this up …
- Futures contract measured move – exact from a MONTHLY SCALE
- UNG percentage measured move – exact
- The 1.68179 extension hit after 233 calendar days … a Fibonacci harmonic
- ABCD hit as the same TIME the extension pattern hit
- The “count” on the way up violates no rules …
- Note, because the all time low clearly went thru the prior low we CANNOT label this as wave 2. The form/structure sure looks like a “B” wave …
Net-Net… this has the potential be a powerful beginning of a 2+ year move. Watch that recent low and weekly close going forward.
Be sure to check out my unique analysis of stocks, commodities, currencies over at Bart’s Charts. Stay tuned and thanks for reading.
Twitter: @BartsCharts
Author does not have a position in mentioned securities at the time of publication. Any opinions expressed herein are solely those of the author, and do not in any way represent the views or opinions of any other person or entity.
: Cup (and Maybe Handle) Watch")
 Trading Near Top Of Price Range")
 Reaches Important Price Support")