We have been watching natural gas prices with the expectation that they can establish a basis for an enduring rally starting near the present price area. The high volatility associated with the commodity sometimes makes technical forecasts difficult, but the current downward pattern appears to be either complete or nearly so. And a Natural Gas price bottom could setup a trade for the popular Natural Gas ETF (UNG).
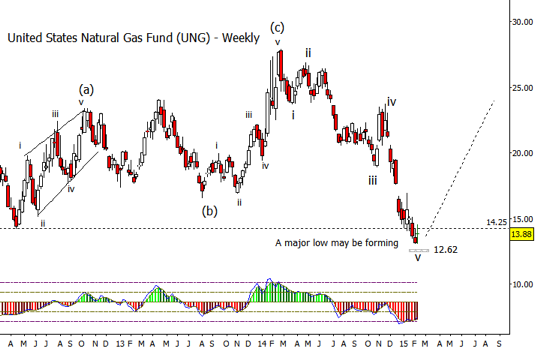
The charts below are for the aforementioned main ETF that tracks natural gas. Since price can be so volatile, many traders prefer to use the ETF rather than futures contracts. On the weekly time frame, the next Fibonacci-derived price support area is near $12.62. Price is currently close enough to the support that it makes sense to watch for a completed count on the next-smaller time frame (the daily chart, which we’ll discuss next).
Natural Gas ETF (UNG) – Weekly Chart
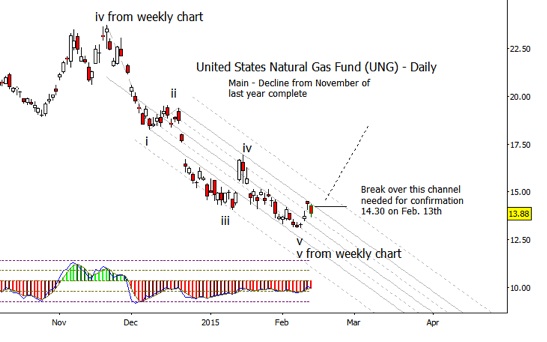
The downward wave v on UNG’s daily chart might be considered complete in terms of form, but that is not a certainty just yet. The first confirming signal of a reversal would be a daily close above the upper boundary of the channel, or above $14.30 as of today, February 13. It always pays to be patient when looking for a bottom, especially with a volatile security like Natural Gas
Natural Gas ETF (UNG) – Daily Chart
Thanks for reading.
Follow Tom & Kurt on Twitter: @TradingOnMark
No position in any of the mentioned securities at the time of publication. Any opinions expressed herein are solely those of the author, and do not in any way represent the views or opinions of any other person or entity.


