It’s been a rough go for Natural Gas prices.
Even with elevated inflation numbers, Natural Gas is still in crash mode.
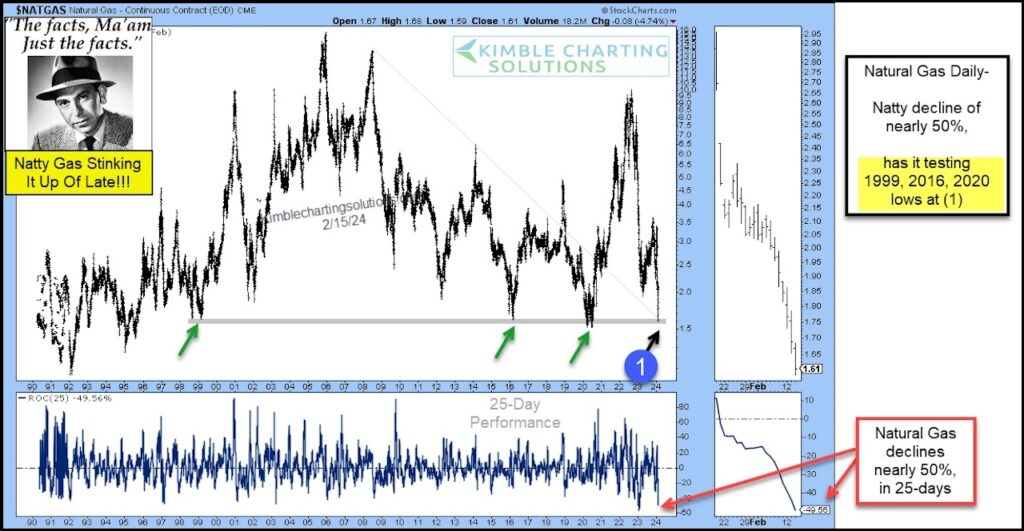
“The facts, Ma’am. Just the facts.” – Joe Friday
Today’s Natural Gas chart highlights the crash in Natural Gas prices. Natty has fallen nearly 50 percent in just 25 days!! That is the 2nd largest 25-day decline in Natural Gas history.
And it is currently testing important lows, a support area that dates back 25-years (1999) at (1).
In my humble opinion, this is a critically important support test following a rare decline. Will Natural Gas bulls show up here? Stay tuned!
Natural Gas Price Chart
Note that KimbleCharting is offering a 2 week Free trial to See It Market readers. Just send me an email to services@kimblechartingsolutions.com for details to get set up.
Twitter: @KimbleCharting
The author may have a position in mentioned securities. Any opinions expressed herein are solely those of the author, and do not in any way represent the views or opinions of any other person or entity.


: Important Breakout Retest")


