A couple weeks ago, I highlighted natural gas as yet another rising inflationary concern.
It was testing it’s overhead 10/40 week long-term moving averages and thus at a critical trading juncture.
Fast forward to today, and it has broken above these two key moving averages. That breakout is just another reason to be concerned with inflation. That said, inflationary concerns are being priced into the market every day… it’s just a matter of whether inflation reaches a tipping point (where it is significantly more than expected).
As traders, we trade what is in front of us. Natural gas futures and the ETF (UNG) can also be traded. The long-term chart looks like it is setting up for a strong move. Below is an updated chart.
Note that the following MarketSmith charts are built with Investors Business Daily’s product suite.
I am an Investors Business Daily (IBD) partner and promote the use of their products. The entire platform offers a good mix of technical and fundamental data and education.
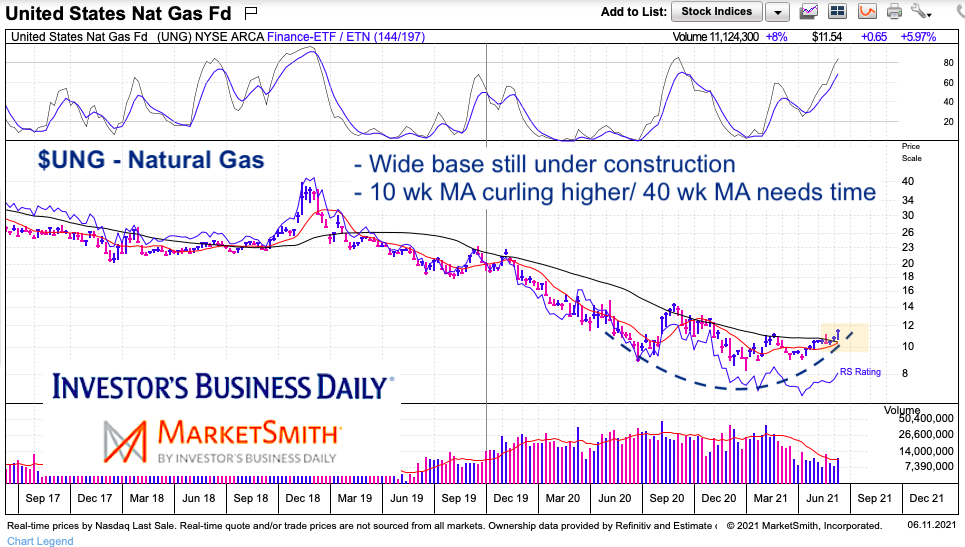
$UNG Natural Gas ETF “Weekly” Chart
As you can see, the Natural Gas ETF (UNG) has broken out over the 10/40 week moving averages. Note that the 10 week moving average is curling higher. This is constructive in keeping the base together.
A flattening 40 week moving average likely means that the consolidation will take a bit more time. Resistance stands at 12.50 to 14.00 (on the ETF).
Twitter: @andrewnyquist
The author may have a position in mentioned securities at the time of publication. Any opinions expressed herein are solely those of the author, and do not in any way represent the views or opinions of any other person or entity.


 Ready To Break Out?")
 Rolling Over At Key Fibonacci Level?")


