There have been many stimulus bills that have been denied, pushed off and almost forgotten about since the initial March selloff.
This time was supposed to be different, since its key purpose was to be a condensed plan in order to keep small business loans and unemployment benefits extended past the December 31st expiration date. A smaller bill in theory would be easier to pass.
As this new rejection takes center stage, it reminds investors the sore truth that our great market comeback still has underlying challenges to face.
That being said, the market has experienced multiple stimulus disappointments and has still managed to break highs.
A temporary fallback could simply be a healthy price correction.
If so, where should we look for the market to hold?
The NASDAQ 100 (QQQ) had the worst day. It closed down over 2% and put in a bonafide reversal topping pattern. After making a new all-time high on Tuesday, Wednesday, it broke Tuesday’s low and failed the 10-day moving average. To make matters worse, the volume accelerated to 44,427,318 shares, well more than any other day since November 10th.
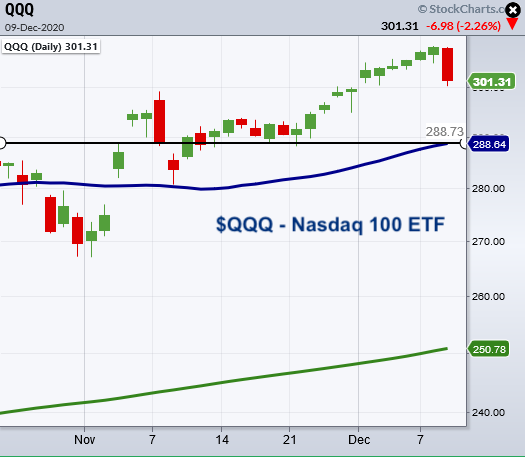
On these reversals, a move of 5-10% can happen. QQQs can go down to 278-288 from here. 288 is the 50-DMA. Perhaps that will stop any bleed.
More importantly, the only way we can say this reversal gets negated is by a move back over 308.60.
Analysts calling for the tech trend to continue after a couple of days of the NASDAQ outperforming were clearly premature. The Economic Modern Family all performed better except of course, our tech sister Semiconductors.
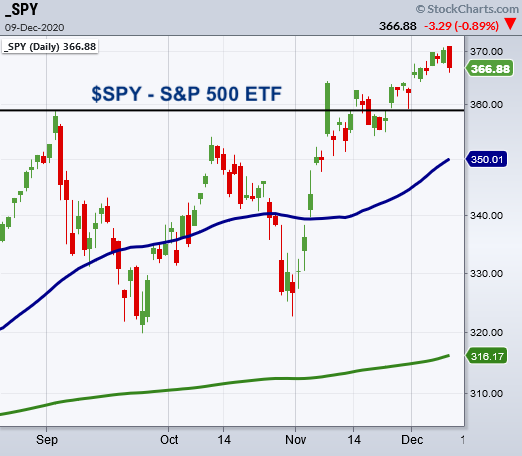
Now let’s look at the S&P 500 (SPY). If a move lower is in store, watch for 359 to hold.
Beyond that could take us back to the 50-day moving average (DMA) which sits at 350.01.
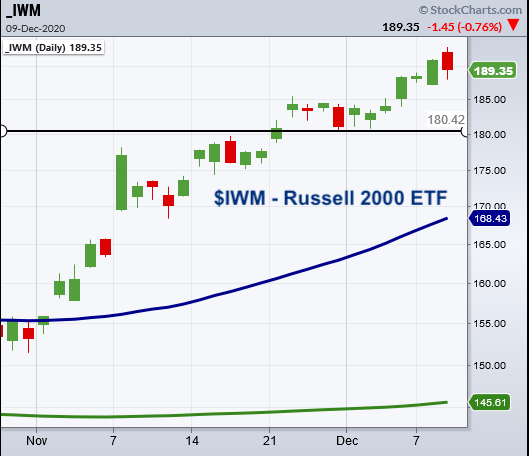
The Russell 2000 (IWM) shows support around the 180 to 184 where it previously consolidated before breaking to new highs.
Furthermore, if the market is the audience and the audience begins throwing tomatoes, there is still time for the Fed to pull things together before the second act or Dec 31st.
Also interesting to note is the best performer today was Regional Banks. Wouldn’t that be something if we see more rotation into the banking sector?
Something to watch.
Here are the major stock market ETFs we follow with trading levels and analysis:
S&P 500 (SPY) 359 is support.
Russell 2000 (IWM) Support resides at 180.
Dow (DIA) 300 is pivotal.
Nasdaq (QQQ) If it breaks 300, 288.64 is support at the 50-DMA.
KRE (Regional Banks) Broke 51.07 resistance but couldn’t hold. Support is 47.22
SMH (Semiconductors) Held over the 10-DMA 213.26 … If breaks watch for 202.80 to hold next.
IYT (Transportation) Holding over 225.49.
IBB (Biotechnology) 145 area is support.
XRT (Retail) Held the 10-DMA at 61.35
Twitter: @marketminute
The author may have a position in the mentioned securities at the time of publication. Any opinions expressed herein are solely those of the author, and do not in any way represent the views or opinions of any other person or entity.


 Ready To Break Out?")

