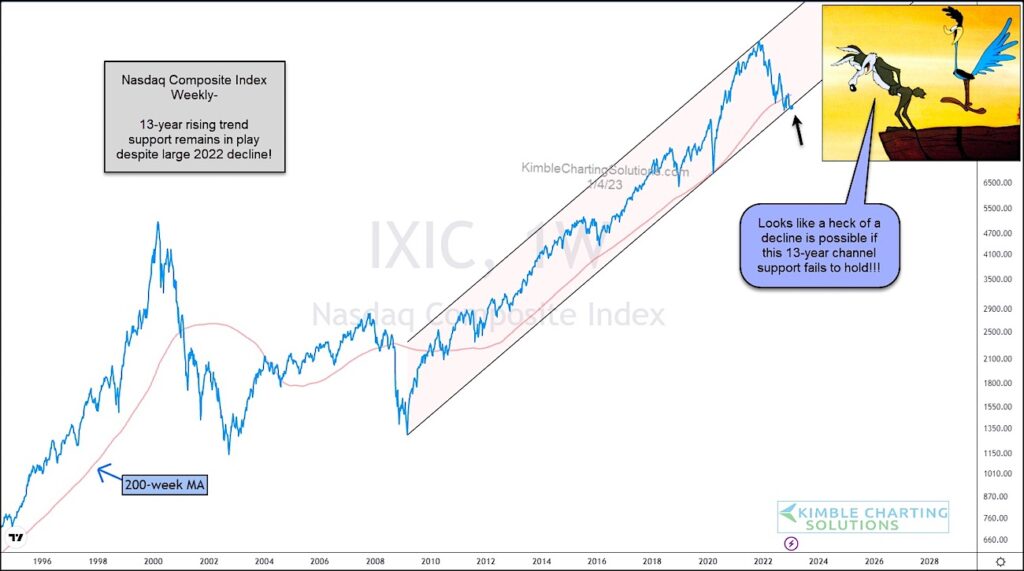
Despite a 33% decline in the Nasdaq, this key stock market index remains inside of this 13-year rising channel.
Barely.
Today’s long-term “weekly” chart of the Nasdaq highlights just how tenuous the bull market is right now. And why investors need to stay focused.
Looking at the chart below, you can see that the 13-year rising channel has proven to be an enduring bull market run… but, is this run over? The coming days/weeks could decide the Nasdaq’s fate.
With the Nasdaq currently trading below its 200-week moving average, it is imperative that the rising trend channel support holds. If not, the decline potential is large. Stay tuned!
Nasdaq Composite “weekly” Chart
Note that KimbleCharting is offering a 2 week Free trial to See It Market readers. Just send me an email to services@kimblechartingsolutions.com for details to get set up.
Twitter: @KimbleCharting
Any opinions expressed herein are solely those of the author, and do not in any way represent the views or opinions of any other person or entity.


: Showing Some Signs of Emerging Strength")
