Technology stocks have been the market leader for the past 13 years.
But what leads on the way up, often leads on the way down. And with inflation and rising interest rates, it’s the growth oriented technology sector that is getting hit the hardest.
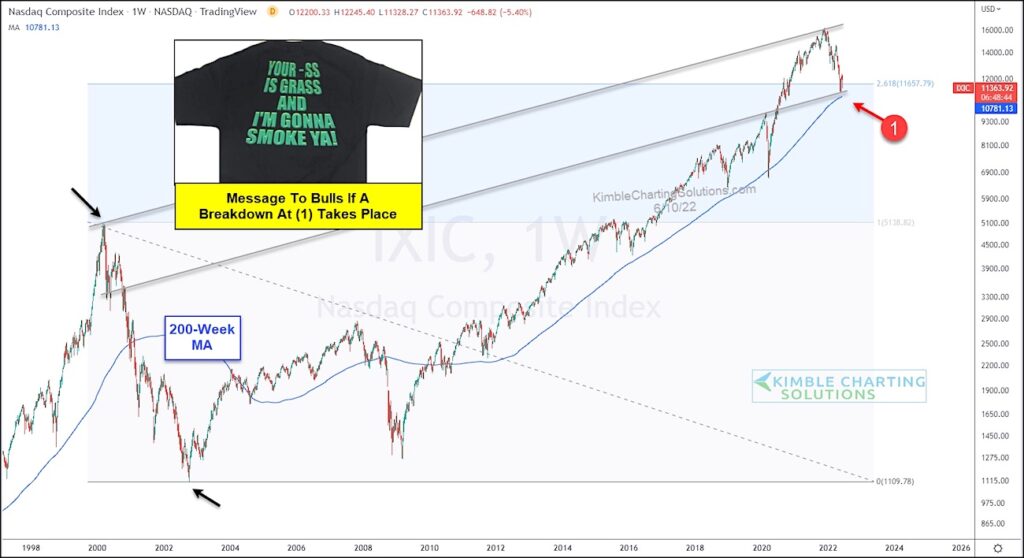
Today we look at a long-term “weekly” chart of the Nasdaq Composite.
As you can see, the Nasdaq soared above its 261.8% Fibonacci extension en route to all time highs last year. But the multi-month decline has seen the index fall over 30%. Yikes!
More important is that the Nasdaq is re-testing its 261.8% Fibonacci level, as well as its 200-week moving average and lower parallel channel support from dot-com highs and initial lows.
Seems to me that this is a very important level for bulls to hold. If we see a breakdown here, I expect selling will accelerate. Stay tuned!
Nasdaq Composite “weekly” Chart
Note that KimbleCharting is offering a 2 week Free trial to See It Market readers. Just send me an email to services@kimblechartingsolutions.com for details to get set up.
Twitter: @KimbleCharting
Any opinions expressed herein are solely those of the author, and do not in any way represent the views or opinions of any other person or entity.

: Showing Some Signs of Emerging Strength")
