The Technology Sector has been a visible leader during the bull market.
But with high beta momentum stocks like Facebook (FB), Twitter (TWTR), Netflix (NFLX), Intel (INTC), and Tesla (TSLA) getting hit hard, investors have taken notice.
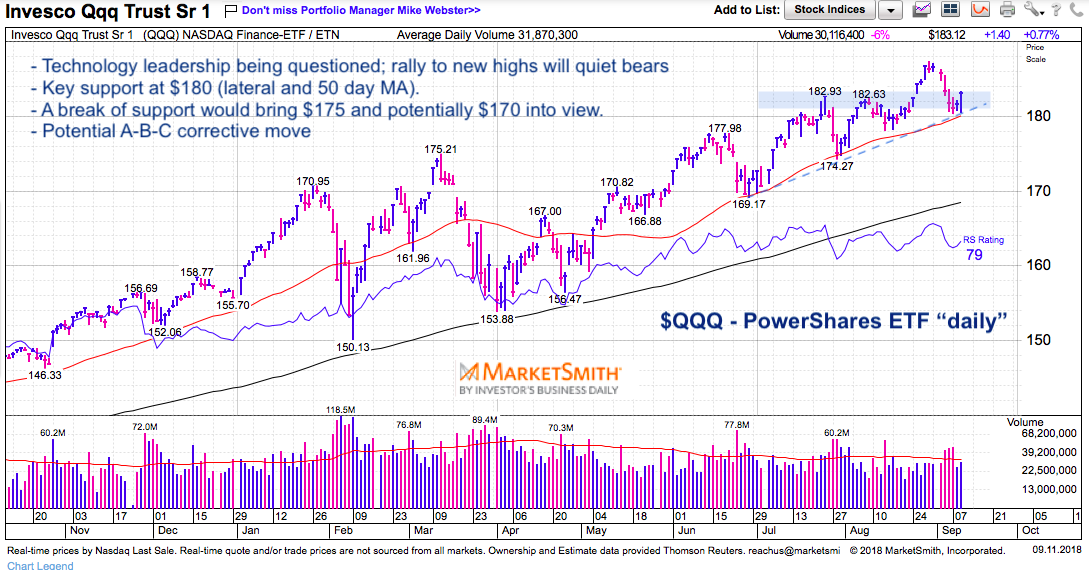
Using the Nasdaq 100 Index and PowerShares QQQ ETF (QQQ) as a proxy, we can see some of the momentum slowdown that manifested itself in the current pullback (-3.8% from highs to lows).
As usual, if support holds the pullback will end and the bull market will carry on. But if it doesn’t, then tech stocks will feel more pressure and perhaps lead the broader market lower. Leaders are important, and price pays. So it goes without saying that it’s important to know what to look for.
The chart below was created using MarketSmith and Investors Business Daily’s product suite. Their services make it easy to sort data and indicators by strongest stocks, industries, and types (growth vs value).
I use the platform for charting, data sorts, and comparative analysis. Note that I am also an Investors Business Daily (IBD) ad partner – you can gain access here.
In the chart below, you can see that the pullback has been magnetized to the $180 level, with the main trading region occurring between 180-183. Today’s long candlestick stretched to the top of that region, giving bulls hope that there’s more upside ahead. We’ll have to wait and see if we get follow through on Wednesday.
My main concern comes from the potential of an A-B-C pullback, which would mean that one more down leg is in order over the near-term. That could begin around here, or around $185 (where last Wednesday’s drop began). And with concerns about inter-tech leadership (with many names getting hit hard), we may need a mini-reset to get going again.
Either way, the uptrend has not been broken as of yet (QQQ is above its 50 and 200 day moving averages). And tere are several layers of horizontal support below: $175, $177, $180 to name a few. If things turn from a pullback into a correction, then $170 and the 200 day moving average will be waiting.
As I’ve stated over the past 5-6 weeks, I’m taking a cautious approach. While I’m bullish longer term and simply looking for a deeper pullback, I think it will be another opportunity for buyers. Watch lists activated…
Nasdaq 100 ETF (QQQ) “daily” Chart
Thanks for reading and good luck out there.
Twitter: @andrewnyquist
The author does not have a position in mentioned securities at the time of publication. Any opinions expressed herein are solely those of the author, and do not in any way represent the views or opinions of any other person or entity.

 Testing Important Price Support")
: Cup (and Maybe Handle) Watch")

