This week has been a wild ride from new highs followed by a quick pullback towards support in certain indices.
High Yield Corporate Debt ETF (JNK) which we use as a risk on or off indicator has broken under minor support from $107.33.
To make things even more confusing, the fear/volatility index (VXX) closed negative and one cent over its 10-Day moving average at $18.82.
Given these mixed signals, the question remains if the market will hold or break lower Monday morning. Though only Monday holds the decisive answer, we should continue to watch the major indices’ pivotal price levels.
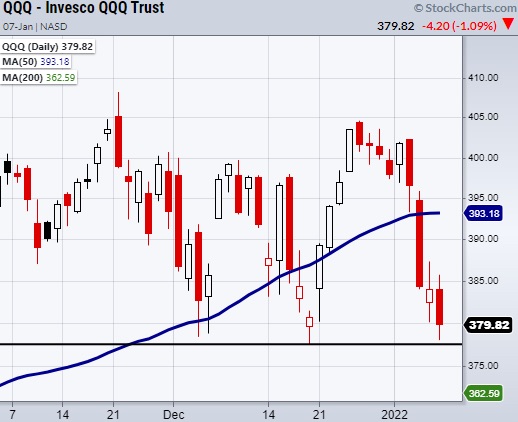
So far, the Nasdaq 100 (QQQ) is the most at risk for breaking the low of its range at $377. This is such an obvious support level that breaking it could easily create a drop towards the QQQs 200-DMA at $363.
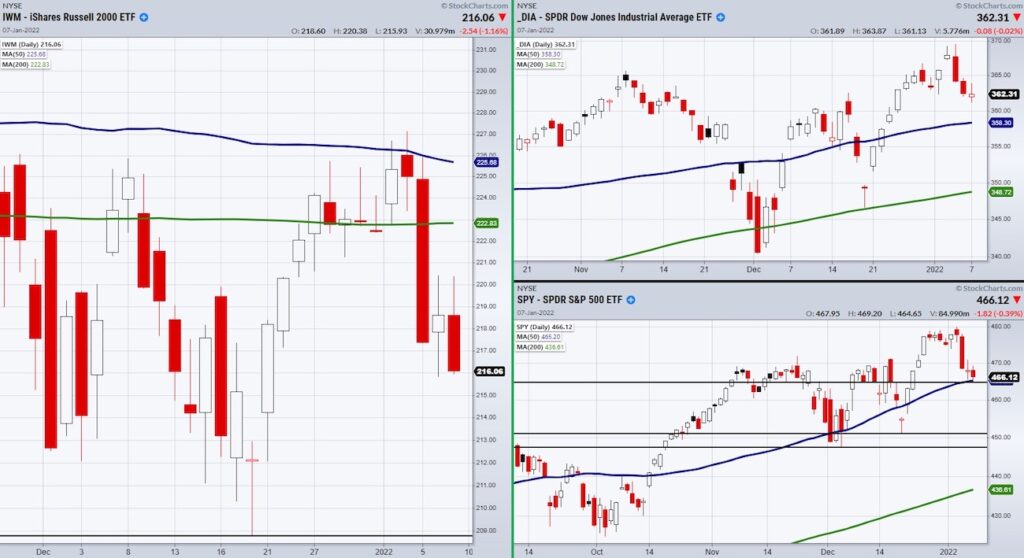
However, the other indices including the Russell 2000 (IWM), Dow Jones (DIA), and the S&P 500 (SPY) have further room before hitting support and if they hold, could prop up the tech-heavy index. The chart below shows support levels drawn in black lines.
In the case of the DIA, its immediate support area comes from the 50-DMA (blue line) at $358.30.
With that said, looking at Mish’s Economic Modern Family, the Transportation (IYT) and Regional Banking (KRE) sectors remain the leaders through this volatile week.
Even with bank earnings coming, their relative strength compared to the overall market make them important areas to watch for trade ideas come Monday morning.
As we head into the new year Mish explains the “Sea Change” with the Federal Reserve policy and what that means for the market. With 2022 being a year where you really need to think before you make investments – you’ll definitely not want to miss this episode!
Stock Market ETFs Trading Analysis & Summary:
S&P 500 (SPY) Like to see this close over the 50-DMA on Monday over 466.34.
Russell 2000 (IWM) Next main support 208 area.
Dow Jones Industrials (DIA) The 50-DMA is close but it’s not a key support area at 58.30. Like it to hold Fridays low at 361.13.
Nasdaq 100 (QQQ) 377.37 support
KRE (Regional Banks) New highs.
SMH (Semiconductors) Main support 288.14.
IYT (Transportation) 281.45 to clear.
IBB (Biotechnology) Watching to find support.
XRT (Retail) 83.54 next support level.
Twitter: @marketminute
The author may have a position in mentioned securities at the time of publication. Any opinions expressed herein are solely those of the author and do not represent the views or opinions of any other person or entity.

: Worrisome to Broader Market?")
