A warning does not necessarily have to become a full-blown sign to head for the exits.
But it is, nevertheless, a warning.
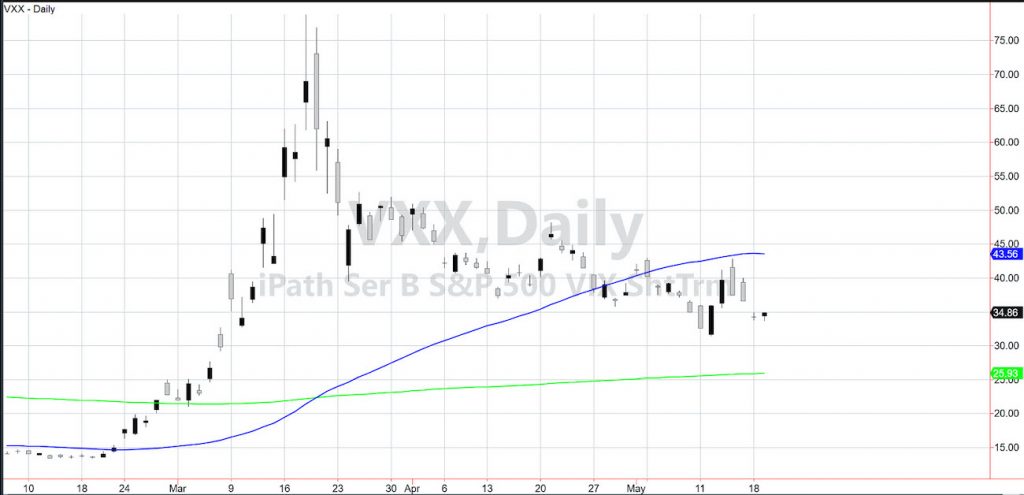
The last time I saw a warning from VXX or the Volatility ETF, was in February.
Granted, on February 5th, the title of my Daily was “Volatility’s Inverted Hammer Doji Warning to Bulls,” and today’s technical pattern is a bit different.
Yesterday VXX had an inverted hammer doji pattern, while today, VXX rallied and closed back over a key weekly exponential moving average.
This does not surprise me either.
In early February, complacency ruled the day.
Today, we are forewarned hence forearmed.
Back in February I wrote, “Although the last couple of days brought back euphoria into the market, with volatility hanging tough, one should be prepared for anything.”
And so it goes today.
With hopes of a vaccine, Moderna ran up the market indices by over 5 percent in just on and half days.
In February, the stock traded at near $20 with a market cap of less than 10 billion.
In 4 months, the stock price rose to over $80 a share and the market cap increased by 26.61 billion.
So typical of the recent market action. Headlines drive price up by 500 points and down by 500 points as quickly as one can say vaccine.
But the volatility index is smarter.
Even with the market trying to move beyond the resistance levels from April, VXX barely budged.
It’s as if VXX knew that Moderna lacked key data needed to legitimize its progress on the vaccine.
VXX is in a caution phase and has a gap to fill at 36.60.
That is the area we will be watching.
Check out my analysis with Angela Miles of BizTV AM — a 3 minute listen from May 18, 2020.
S&P 500 (SPY) 299.42 is price resistance with 288.30 support.
Russell 2000 (IWM) 127.75 is price support with resistance at 136.85
Dow Jones Industrials (DIA) 239.50 is price support with resistance at 247.67
Nasdaq (QQQ) Filled the gap to 229.32, then sold off. 223.50 is price support.
KRE (Regional Banks) Prodigal doing prodigal-run and then slump back. 33.15 is price support.
SMH (Semiconductors) 140 price resistance with 134 acting as support.
IYT (Transportation) 150 price resistance with 140 price support.
IBB (Biotechnology) A key reversal failure pattern today.
XRT (Retail) Could not hold 38.50 so looking at 37.20 as price support.
Volatility Index (VXX) 36.60 price resistance to clear.
Junk Bonds (JNK) 100 price resistance with 97.50 price support.
LQD (iShares iBoxx High yield Bonds) 130 price resistance with 127.50 support.
Twitter: @marketminute
The author may have a position in the mentioned securities at the time of publication. Any opinions expressed herein are solely those of the author, and do not in any way represent the views or opinions of any other person or entity.
: Cup (and Maybe Handle) Watch")
 Trading Near Top Of Price Range")
 Reaches Important Price Support")