Today my One Chart is actually an individual stock, Microsoft NASDAQ: MSFT.
I’m not picking Microsoft because they are headquartered nearby in Redmond, WA,
I’ve chosen it because it has remained in a position of strength while other stocks have struggled.
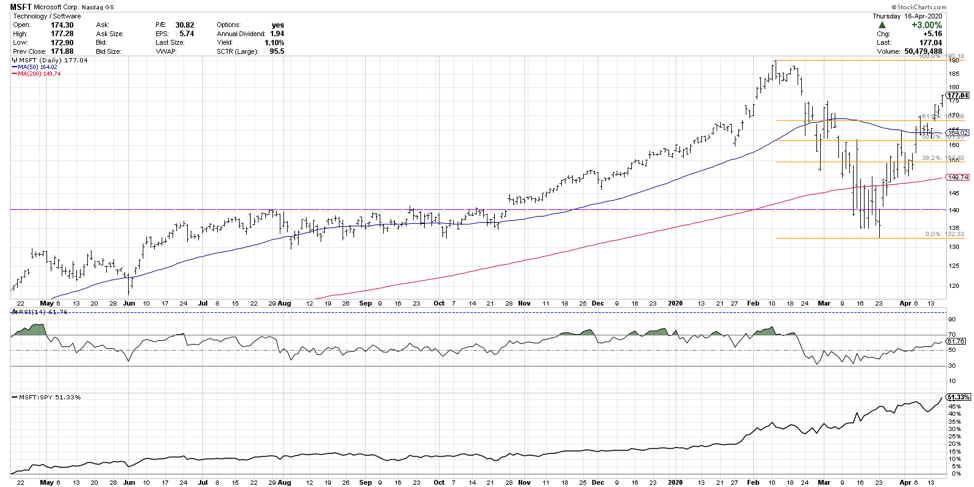
This chart is looking at the price of Microsoft over the last year, the RSI and the relative strength of Microsoft compared to the S&P 500 in the bottom panel. See below.
The first thing that jumps off the page is that the relative strength has been accelerating and is consistently headed up and to the right.
If you ignore the top couple of panels and just look at the relative strength at the bottom, you wouldn’t expect that the market has gone through all the turmoil it has because the relative strength of Microsoft has been pretty consistently positive.
In a lot of ways, the chart of Microsoft mirrors the chart of technology (XLK) as a whole. I would argue that Microsoft, in particular, is one of the leading names on a relative basis. As a lot of stocks are struggling to outperform, Microsoft has consistently made new relative highs in this past year, and especially in this last week.
Another interesting point to note is that while the S&P 500 has retraced about 50% of its February to March decline, Microsoft has actually eclipsed the 61.8% retracement. From a purely Fibonacci perspective, this would suggest we’re on our way back to previous highs, and it’s entirely reasonable that Microsoft could get back to its previous high of around $190.
The RSI has broken above 60. In a bearish phase, the RSI tends to dip into oversold territory and then never really gets above 60. In a bullish phase, you’ll see the RSI become overbought and rarely get below 40. In the left half of the chart, which ranges from mid-to-late 2019, the RSI was consistently in that bullish range and pullbacks were around 40. However, toward the end of 2019 and into 2020, the RSI never even got below 50.
In late February this all changed as many stocks got oversold or extremely oversold, and Microsoft pulled back but never actually became oversold. The relative strength recovered very well so it outperformed in the down phase and it outperformed in the up phase. A stock like this that outperforms in both bull and bear phases suggests it should be a core holding. This is the type of security that you could build a portfolio around and feel pretty good about its consistent ability to outperform.
Microsoft appears to be sort of a “poster child” for this bear market rally. After the sell off from February to March, I would argue that the recent weeks don’t appear to be a counter-trend rally. If you look at the chart of Microsoft, it looks like a healthy rally out of these lows. As long as this chart continues in a position of strength, the overall market environment appears potentially more constructive than you might think if you didn’t see Microsoft doing that well. If Microsoft, obviously one of the largest companies in the world, has a chart this good, then how bad can the world be around it?
Microsoft appears to be more and more of an outlier in looking this attractive. Stocks like Microsoft, Netflix, Amazon, Newmont Mining, and Regeneron, these are in real positions of strength. Meanwhile, average stocks are nowhere near their previous highs. They are not really outperforming, just overall giving a skeptical “end-of-the-bear-market-rally” type of vibe.
From a breadth perspective, another question is whether this chart of Microsoft seems to be unique and is an outlier relative to other stocks. You could have a situation where a small number of names, Microsoft potentially included, continue to do well and outperform while the average stock starts to weaken.
Another way to validate this chart is to look at the underperformance of small caps, which certainly seems to be persisting. This suggests the average stock is not really participating in the rally as we see for Microsoft.
This One Chart is meant to highlight a mega cap name which is outperforming in both bull and bear cycles. Microsoft is a stock that investors are voting on for long term appreciation but are also regarding as a safe haven. Truly an all-weather stock.
To watch this in video format, just head over to my YouTube Channel!
Twitter: @DKellerCMT
The author does not have a position in mentioned securities at the time of publication. Any opinions expressed herein are solely those of the author, and do not in any way represent the views or opinions of any other person or entity.

 Testing Important Price Support")
: Cup (and Maybe Handle) Watch")

