After the apple hit Sir Isaac Newton’s noggin, he, and subsequently the rest of the world, understood gravity – what goes up must come down.
There is also a form of gravity in the financial markets, which often goes by the adage mean reversion.
This post was written with Craig Basinger.
While it may not be as strong as the physics version of gravity, nor as consistent (physics gravity is relentless), the financial markets often experience a pretty strong mean reversion. Not just what goes up often comes back down but what goes down can often come back up, at least somewhat. This appears to be especially acute after extremes in one direction or the other and appears to be evident in share prices, earnings and economic data. In this report we are going to focus on share prices.
Mean reversion (or our new name, Financial Gravity) appears to be most acute after sudden and material moves in share prices.
This has important implications for investors. As often can be the case, when a stock is moving fast, there is a heightened desire to act. This can be to bail on the downside, as the drop hits a pain threshold or rush to join in the upside, not wanting to miss out any longer. Based on our analysis, we would argue for not making a ‘knee jerk’ reaction or sudden move, as big moves often tend to mean revert in the short term.
What we did
Using the S&P 100 constituent members we measured three-day price changes over the past five years. An extreme move was measured as a three-day move that was at least two standard deviations outside the norm for the company over the past year, either on the high or the low side. We then measured the subsequent share price move over three, five and ten days. In each combination we calculated the average, median price return and the percentage of instances that were positive.
Chart 1 below shows the median performance after a share price decline or rise that was in excess of two or three standard deviations. There is clearly a relationship that returns appear more substantial following a big drop (blue bars). Conversely, gains appear muted following a big share price gain (orange bars). To put these values into perspective, the median performance for the entire universe is +0.18%, +0.30% and +0.56% for three days, five days and ten days respectively landing in between negative and positive deviations.
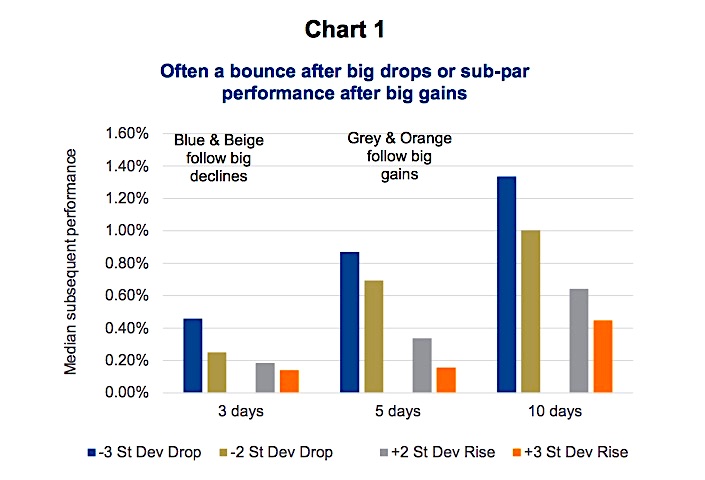
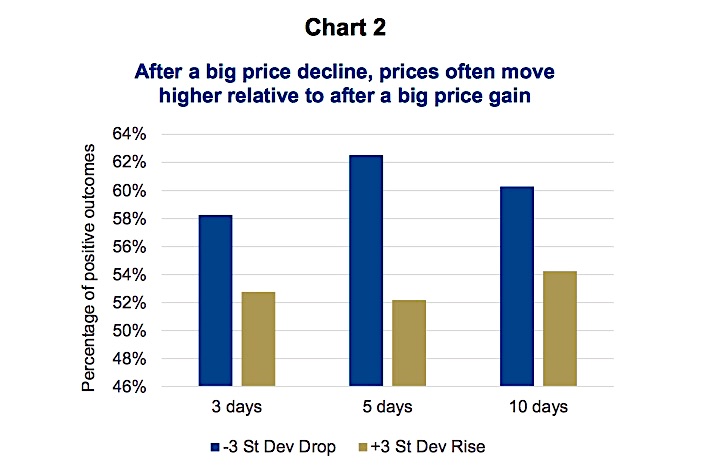
Chart 2 below shows the probability of a move higher in price following either a big price decline or a big price gain. Again, after a decline there is a higher probability of a price rebound compared to after a big price gain. Mean reversion…
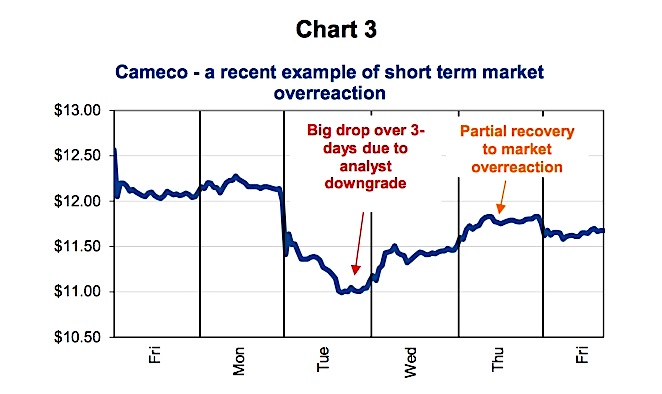
Why – Markets overreact to surprises
In the short term, it would be clear that markets tend to overreact to surprise news. In this analysis we did not differentiate given the cause of the original price move. Many of these, both positive or negative, are attributable to an earnings surprise or surprise news event. Based on the analysis, it would appear that prices tend to overreact to whatever the news was and subsequently mean revert. This trend does appear to be more reliable following price declines.
Investment implication
Investors, us humans, tend to overreact to surprises in the market for a given company. It would appear that following a positive surprise and move higher in a stock’s share price over a three- day period, subsequent near term return expectations should be muted. Conversely, following a sudden decline, for whatever reason, share prices more often see a degree of rebounding.
This is all mean reversion, or if you prefer ‘financial gravity’ back towards the previous trend. As a result, investors should not try and chase near term returns after a sudden jump. And following a sudden sell-off, may want to reconsider bailing, waiting for a potential short term partial rebound.
Charts are sourced to Bloomberg unless otherwise noted.
Twitter: @sobata416 @ConnectedWealth
Any opinions expressed herein are solely those of the authors, and do not in any way represent the views or opinions of any other person or entity.


: Showing Some Signs of Emerging Strength")
