As the stock market roller coaster ride continues, one sector that has been out-performing is the Materials (XLB).
But this sector is also at a critical inflection point, testing major breakout resistance.
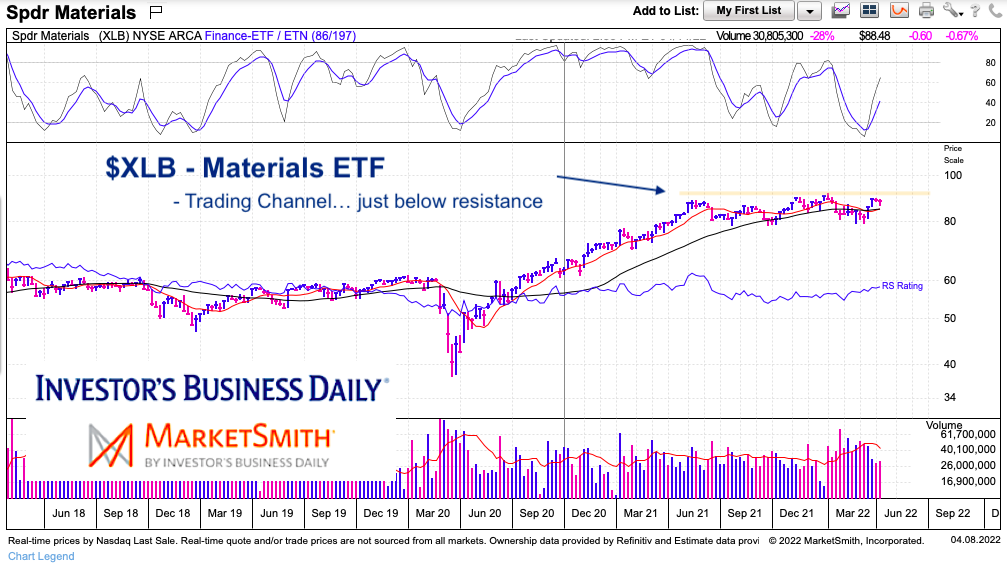
Over the past several weeks/months, the Materials sector has traded in a sideways price channel. A breakout would be a strong sign for gold and silver (precious metals), and copper.
But this is by no means a given. Yes, we are in a volatile world with uncertainty… but how much of this is priced in? We shall find out soon. Let’s look at the chart.
Note that the following MarketSmith charts are built with Investors Business Daily’s product suite.
I am an Investors Business Daily (IBD) partner and promote the use of their products. The entire platform offers a good mix of analysts, education, and technical and fundamental data.
$XLB Materials Sector ETF “weekly” Price Chart
Here’s a long-term look at the Material Sector ETF (XLB). Pretty easy to follow the COVID crash in 2020 followed by the steep rally into 2021. But the past year has traded sideways. Materials have woken up lately… will it be enough for a breakout? Or will resistance hold and keep a lid on the sector.
Twitter: @andrewnyquist
The author may have a position in mentioned securities at the time of publication. Any opinions expressed herein are solely those of the author, and do not in any way represent the views or opinions of any other person or entity.

 Testing Important Price Support")
: Cup (and Maybe Handle) Watch")

