The Materials Sector ETF (NYSEARCA: XLB) experienced a nice rally from April to July.
But that rally stalled near prior highs (price resistance). And its traded sideways ever since.
More recently, the 20 and 50-day moving averages have caught up to the Materials Sector ETF (XLB) while momentum has weakened.
Today, we look at the chart to highlight why this may be an important juncture for XLB.
Note that the following MarketSurge charts are built with Investors Business Daily’s product suite.
I am an Investors Business Daily (IBD) partner and promote the use of their products. The entire platform offers a good mix of tools, education, and technical and fundamental data.
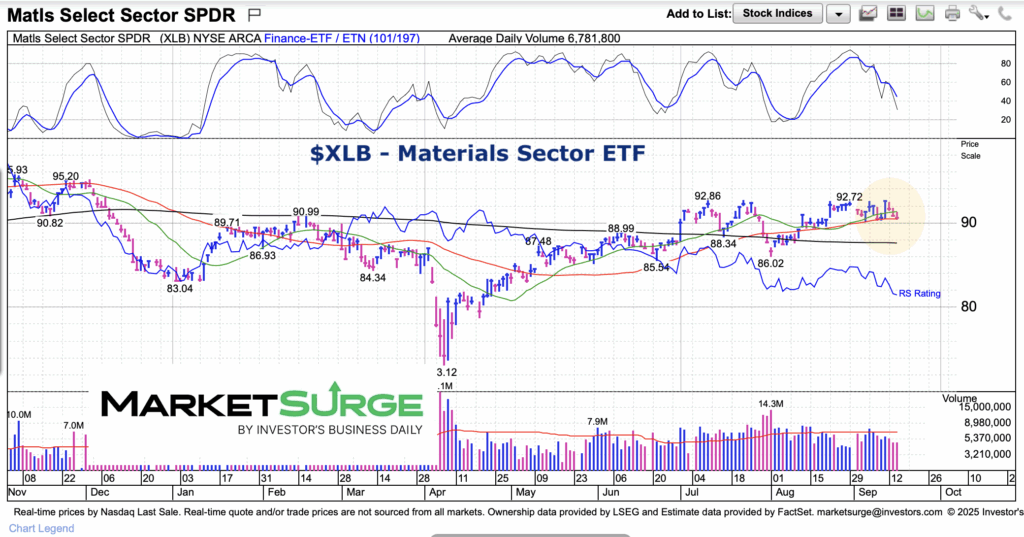
$XLB Materials Sector ETF Chart
Here we can see the heavy price congestion for XLB over the past 3 months. And, while price is trading in the middle of that range, it’s also just below its 20-day moving average and resting on its 50-day moving average… with falling momentum.
For bulls, this would be a good time to see buyers come in. If they don’t show up here, however, then this could be the start of a pullback.
Twitter: @andrewnyquist
The author may have a position in mentioned securities at the time of publication. Any opinions expressed herein are solely those of the author, and do not in any way represent the views or opinions of any other person or entity.
")

 Front Running Oil Prices")


")
