S&P Futures (near-term trading outlook): – Bullish, growing more positive over 2104 for a move to 2122-3- The neutral range in the last week should give way to more volatility in the days ahead but I’m favoring a bullish bias given the positive action in Healthcare, Industrials with A/D lines back at new all-time highs. A daily close over 2104.75 is necessary to project back to new all-time highs for S&P 500 futures as well as the S&P 500 Index (INDEXSP:.INX). Conversely, a move below 2065 would postpone the S&P 500 rally.
TECHNICAL THOUGHTS
S&P finished on Thursday within 2 S&P points of last Friday’s close, and NFP data could very well prove to be the catalyst that results in the surge back to new all-time highs. And with the Advance/Decline line at new highs, this suggest that it should happen. Bond yields are trying to bottom out, while sectors like Healthcare and Industrials have both been showing much better signs of strength.
Bond yields showed some upward progress on Thursday and could rise even further with a strong NFP number Friday. Financials are likely to benefit as rising Bund yields should favor European Banks starting to lift from very oversold conditions, so much of what has been written about in the last few days remains key to focus on, and has not changed.
The US Dollar index could begin a larger rally given the weakness in Pound sterling which has a lot of momentum vs USD while the BOJ meeting is on deck for the Japanese, with most eyeing Kuroda to attempt to weaken the Yen using new methods. Meanwhile, the technical charts of the Euro vs USD still appear quite weak after breaking the six-month uptrend. Favorable US Economic data in the weeks ahead should serve as the catalyst for the US Dollar to turn back higher, which in turn would likely exert lots of negative pressure on commodities.
Crude oil in particular managed to give back all of Wednesday’s gains after dismal inventory data on Thursday, and yet again finds itself at a key intersection of important support which typically has been wise to buy into. However, prices dropped much more than expected on Thursday and its necessary that Crude bounce back sooner than later to recapture this week’s losses. The pattern at this point resembles an overlapping choppy consolidation pattern, which was thought to lead back to highs. For now, a lot of work needs to be done and first and foremost, holding above 45 on the downside and then rising back over $50.
See charts and additional analysis below.
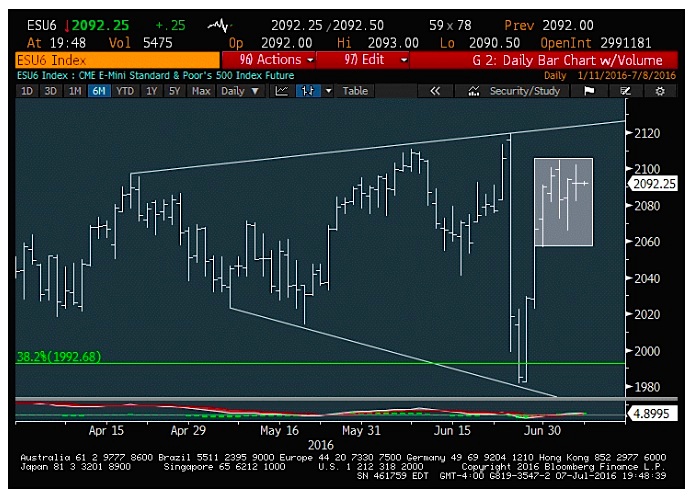
S&P 500 Futures
The S&P 500 has barely budged over the last week after the prior week’s sharp gains. A bullish bias is based largely on Bond yields bottoming out, NOT TOPPING, along with Advance/Decline being back at new all-time highs while various former underperforming laggard sectors like Healthcare, have begun to outperform. Technical proof for price confirmation in the S&P futures will require movement back over 2104.75 on a daily close, which should help prices to accelerate back up to near 2130 in short order. charts created at Bloomberg
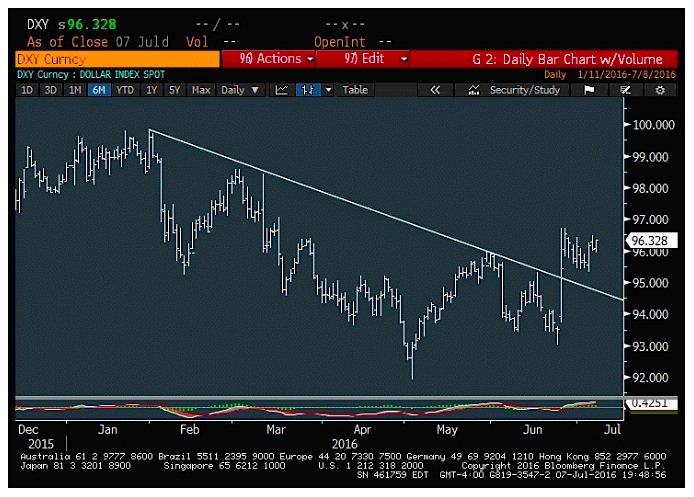
U.S. Dollar Index
The US Dollar index looks poised for a sharp move higher, given the minor consolidation following the previous week’s BREXIT Breakout. The act of turning back higher in recent days bodes well for a move up above 97 which in turn would likely cause further selling pressure in commodities. A strong jobs number for June, (which is not being forecast based on previous June vs May weakness) would likely result in the US Dollar turning up vs quite a few developed and Emerging market currencies.
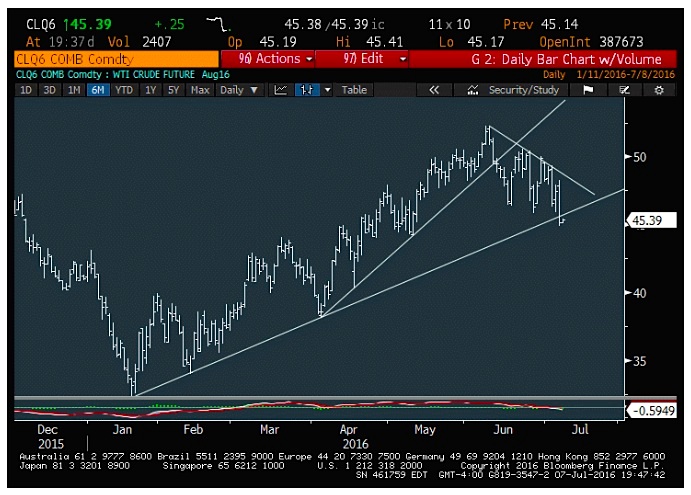
Crude Oil
WTI Crude oil, meanwhile, has slipped down to near key make-or-break territory after Thursday’s bearish DOE stats, and will need to rally quickly to avoid undercutting this six-month uptrend line which has been in place since January. The pattern at present looks more like consolidation than the start of a larger top for Crude, so its possible to forecast a move back up above $50 which could take WTI higher into September before a larger peak. For now, prices lie at make-or-break and tough not to consider longs a “failure” on a daily close back under $44.75.
Thanks for reading.
Twitter: @MarkNewtonCMT
The author may have a position in mentioned securities at the time of publication. Any opinions expressed herein are solely those of the author, and do not in any way represent the views or opinions of any other person or entity.


 Analysis: Bulls Eye Down-Trend Line")


