Many long-term investors are aware of market seasonality trends that can provide tailwinds or headwinds for particular assets. But there are several indicators that macro and trend investors should also be following and aware of.
Here is a high level recap of today’s research post:
– Seasonal headwinds are setting in for stocks.
– Looking across assets, risk assets tend to underperform from June-Nov, and defensive assets tend to outperform during that same period.
– The internal consistency across markets makes intuitive sense and highlights the importance of seasonal patterns in market analysis.
– That said, there are many exceptions to the rule, and thus market seasonality trends should never be the primary component of an investment thesis.
Seasonality in the stock market is a relatively well understood and widely researched phenomenon. There are a few different sayings such as “Sell in May“ or the “Halloween Effect“, but all refer to the tendency for stocks to be dead money from around June through November.
So it’s timely to review the seasonal patterns in stock market returns as the seasons shift, but it’s also especially interesting to observe how a few other key markets also exhibit similar seasonality.
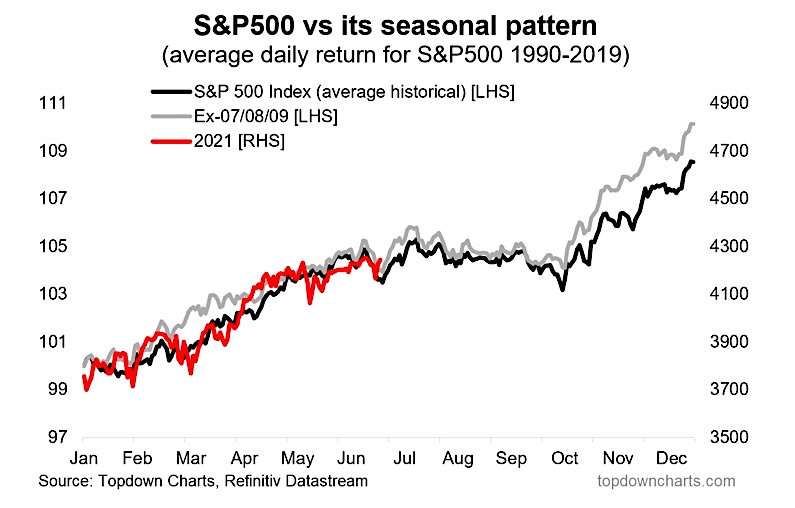
1. S&P 500 – Sticking to the Script: A quick word on methodology; the seasonality lines in the chart below show the average daily change in the S&P500 index by business day. As such it is a characterization of how the market has traded historically – and being an average it masks the fact that actual experience can wildly differ from historical tendencies. That said, the S&P500 seems to be largely following the seasonal script so far this year…
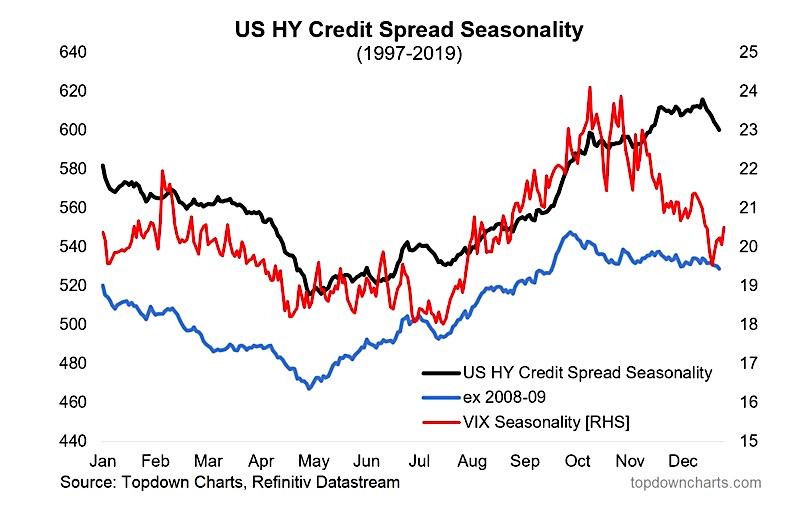
2. Risk Pricing Seasonality: The next chart shows the average path of the level of US high yield credit spreads (credit risk pricing) and the VIX (equity risk pricing). Historically there has tended to be an upward drift in risk pricing in Q3 – basically the mirror image of what you tend to see in equities (see chart 3).
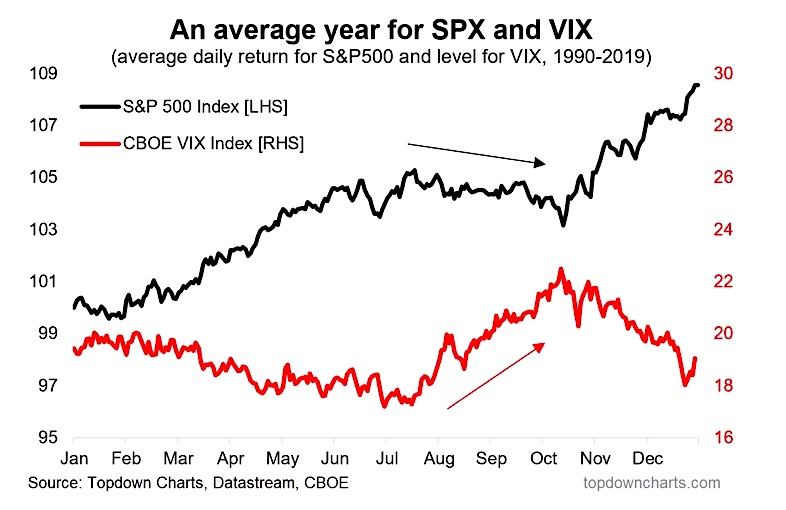
3. The Seasonal Map: As indicated, there is a fairly logical/intuitive inverse seasonal tendency for the S&P500 and the VIX. Curiously though no one really seems to know for sure why it happens that equities tend to underperform from June-Nov.
Suggestions include: the impact of summer vacations (people sell/don’t buy during their down time), the possible existence of a self-fulfilling prophecy (if everyone expects it then they act on it and reinforce it), and a range of other possibilities such as the impact of the January effect, interest rates, political climate, weather climate, etc..
Interestingly, as the next two charts show, this time of the year also sees clear seasonal tendencies for the US dollar and treasury yields.
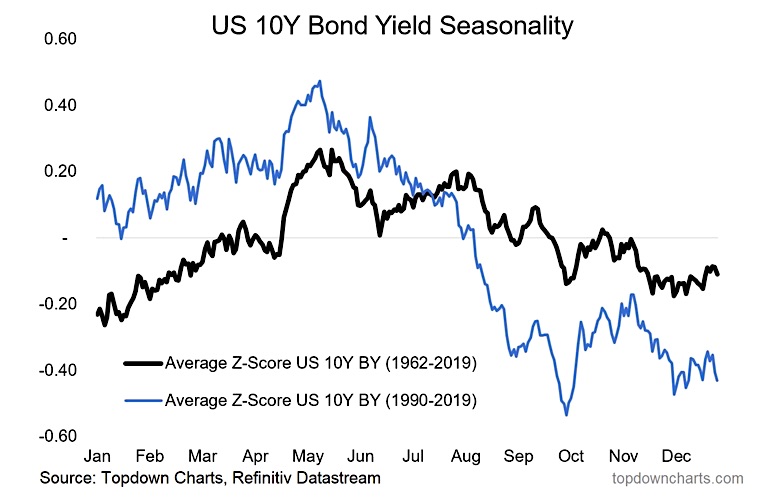
4. Bond Yield Seasonality: As you might guess given the usual expected correlation (or at least the intuition that bonds act as a diversifier against equity risk), bond yields tend to fall from June through Nov [i.e. government bonds tend to rally].
One might be tempted to suggest that portfolio rebalancing could be partly to blame (since equities tend to outperform in the earlier part of the year). Either way, it’s interesting to see the internal consistency from a cross-asset standpoint.
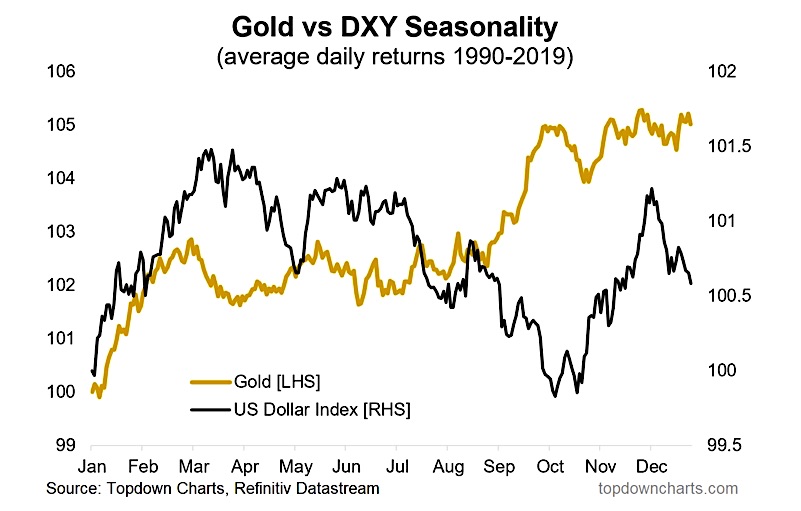
5. US Dollar and Gold: Lastly, to add to the intrigue, gold tends to rally from around June/July through to November, and conversely, the US dollar tends to drift downwards during the same period (actually the USD tends to peak from a seasonal standpoint around March/April).
So again we have another layer of cross-asset internal consistency in that risk assets tend to underperform and safe/defensive assets tend to outperform during that June through November period.
Final Thoughts: The first thing I want to say before signing off is that seasonality is simply a statistical characterization of what happened in the past. Being an average it masks the possibility of sometimes wild gyrations of experiences around that average.
Personally I think of seasonality as very interesting information. But I would never use it as a core part of an investment thesis. I might use it as a prompt to investigate more fundamental/reliable factors – to see if there is something there, or as a finessing factor after having already established a solid core thesis.
So you wouldn’t necessarily want to go making bold prognostications on one seasonality chart, but it certainly gives you something to think about. Perhaps the most interesting observation across the charts in today’s blog is the internal consistency across assets: from around this time of the year through to November, there is a clear historical tendency for risk assets to underperform, and defensive assets to outperform.
In the current backdrop this is actually quite interesting because we are well-progressed in the market cycle, so I think it wouldn’t be at all out of place to see a bit of turbulence in the coming months – as the seasonal shifts suggest.
Twitter: @Callum_Thomas
Any opinions expressed herein are solely those of the author, and do not in any way represent the views or opinions of any other person or entity.


: Showing Some Signs of Emerging Strength")
