 by Greg Naylor April was an uneventful month on the economic front, as the conflict in the Ukraine entered a quiet news zone, the Fed continued to unwind QE, and major economic news items showed a continued slow recovery. Stocks drifted higher, as did bonds. Here is what happened in the capital markets, by the numbers:
Stocks & Bonds
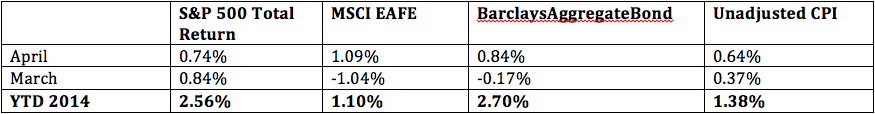
In April the U.S. capital markets continued to move higher, welcoming the unwinding of QE as a positive sign from the Fed that the recovery should continue. Interestingly, the unwinding of QE has so far not let to higher bond yields, contrary to the views of a majority of analysts. Of course, the majority is often wrong with market predictions. International stocks also gained in March, and inflation remains below the official Fed target. By the numbers:
Commodities & Currencies
NYMEX crude prices softened slightly in March, from $100.82 to $99.74 per barrel. Year to date, prices are up about 3%. A glut of oil and a soft global recovery are providing headwinds for oil prices, while tailwinds come from factors such as uncertainty in the Ukraine. Gold prices gained about 1% in March, to $1,295.90 per ounce. Year to date gold prices are up just under 8%, on the heels of double-digit declines in 2013. The dollar continued its monolithically slow march downwards, losing not quite 1% in March against a trade-weighted basket of currencies. For the year, its value is essentially unchanged.
Economy
The Department of Commerce released its first estimate of 1st quarter GDP. They estimated that the economy grew at a 0.1% annual rate in the first quarter of 2014, and confirmed that the 4th quarter of 2013 saw growth of 2.6%. The 0.1% estimate was a big downside surprise, although most economists suggest that the difficult winter had an outsize effect on consumer spending, so the hope is that the 2nd quarter sees a ‘big’ GDP number as a result of consumers finally being able to shop.
For the full year of 2013, GDP growth was 1.9%, quite a bit slower than the 2.8% growth of 2012. The Commerce department cited weakening consumer spending, as well as weakening federal spending and less non-residential construction activity as the primary reason for the slower growth. So far the stock market has been shrugging off the QE unwind and weak GDP numbers, choosing to focus on analyst projections of better days ahead.
The unemployment rate dropped from 6.7% in March to 6.3% in April. 288,000 jobs were added in the economy, and even more significantly, 806,000 people left the work force. This coincided with the end of emergency federal unemployment benefits. Many workers who had been receiving unemployment benefits have given up looking for work, so they are no longer counted as unemployed.
The Institute for Supply Management had continued good news, reporting that April’s manufacturing PMI was 54.9, up from March’s 53.7. A reading above 50 indicated economic expansion.
The National Association of Realtors (NAR) reported that the annual rate of existing-home sales in March fell by 7.5% from March 2013. Analysts believe and hope that this is the result of the difficult winter, and that growth will resume into spring and summer. The national median price rose from the prior year by 7.9% to $198,500. Foreclosures and short-sales, as a percentage of overall sales, were at 14%, higher than the historical average but lower than at the heights of the housing crisis.
Summary
The economy continues to muddle along. So far, the stock market has been focusing on positive GDP numbers and earnings growth. However, GDP growth is not particularly robust. In addition, the shrinking unemployment rate does not mean what it used to, in my opinion. Usually we watch the unemployment rate because it is a good indicator of recovery or recession. However, I do not believe it is such a good indicator today. What we really want to see is more people working, and earning more money, so that they can spend and create economic activity. And normally, that’s exactly what a falling unemployment rate indicates.
However, as you can see in the preceding paragraph, the falling unemployment rate is not primarily because of added jobs. In fact, the economy only added 288,000 jobs. The much bigger impact came from the 806,000 people who left the labor force entirely. This 806,000 have gone on to retirement, either regular or early, or perhaps disability. The easier way to understand this is that the baby boomers are finally retiring – the ‘pig in the python’ has arrived. This will likely make the Federal Reserve’s job more interesting (and perhaps complicating), especially as they continue their attempt to unwind QE.
The labor force participation is at its lowest since 1978, only 62.8%. For every 6 people working, 4 are not. Worse, incomes are not rising for the 6 out of 10 – they are falling in real terms. The economists who argue that we are entering a Japanese period of deflation, inextricably linked to an aging population, seem to have some supporting evidence. So, when consumers have less to spend and are less willing to borrow, company selection is even more important in a diversified portfolio. Some that have pricing power and a competitive advantage will perhaps do better than others that have too much debt or products that cannot compete. As always, we believe investors should take the long view, remain diversified, and wear sunblock.
This material was prepared by Greg Naylor, and should not be construed as investment, tax or legal advice and may not be relied upon for the purpose of avoiding any Federal tax liability. This is not a solicitation or recommendation to purchase or sell any investment or insurance product or service, and should not be relied upon as such. The S&P500, MSCI EAFE and Barclays Aggregate Bond Index are indexes. It is not possible to invest directly in an index.
Investing involves risks and investors may incur a profit or a loss. Past performance is not an indication of future results. There is no guarantee that a diversified portfolio will outperform a non-diversified portfolio in any given market environment. No investment strategy can guarantee a profit or protect against loss in periods of declining values.
Data Sources:
- www.standardandpoors.com – S&P 500 information
- www.msci.com – MSCI EAFE information
- www.barcap.com – Barclays Aggregate Bond information
- www.bloomberg.com – U.S. Dollar & commodities performance
- www.realtor.org – Housing market data
- www.bea.gov – GDP numbers
- www.bls.gov – CPI and unemployment numbers
- www.commerce.gov – Consumer spending data
- www.napm.org – PMI numbers
- www.bigcharts.com – NYMEX crude prices, gold and other commodities
- https://data.bls.gov/timeseries/LNS11300000 – Labor participation data
About Greg Naylor: Greg is a partner and co-founder of Fiat Wealth Management, an independent financial advisory firm in Long Lake, Minnesota. He has been investing for over 7 years and enjoys sports, reading, singing, and spending time with family. Greg is a 2004 graduate of the University of Minnesota and lives in South Minneapolis with his wife Kat.
Any opinions expressed herein are solely those of the author and do not in any way represent the views or opinions of any other person or entity.

: Worrisome to Broader Market?")
