What We Are Watching
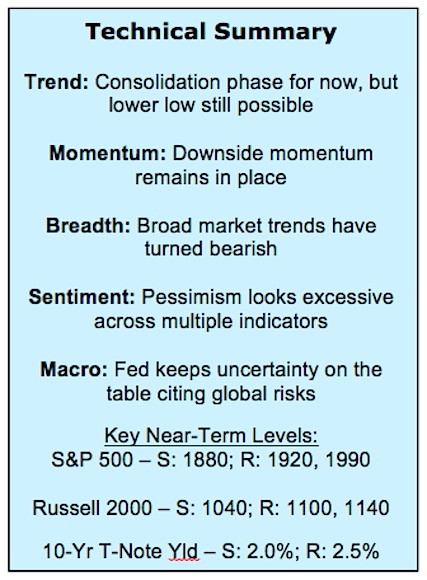
This Week’s Market Outlook:
Upside Momentum Still Lacking – Stock market lows are most evident after the fact, as evidence of their being in place accumulates. Early signals usually included sustained rallies accompanied by breadth thrusts that halt downside momentum and provide upside impetus. Such signals are lacking in the current environment and have a negative impact on the market outlook.
Investors Fearful – Strong demand for put options, massive outflows from equity mutual funds, and a continued rise in bearish sentiment on the investor surveys suggest pessimism has become widespread enough to help limit (in degree and duration) further near-term downside for stocks. We could still see final capitulation, but market sentiment has turned more favorable.
Bond Yields Drifting Lower – Not only do Treasury yields continue to move lower, but spreads continue to widen. The bond market appears to be lending some credence to equity investor fears. To some extent the rally in Treasuries (which pushes the yield lower) reflects the unwinding of excessive pessimism in bonds. The 10-year T-Note yield is approaching support near 2.0%.
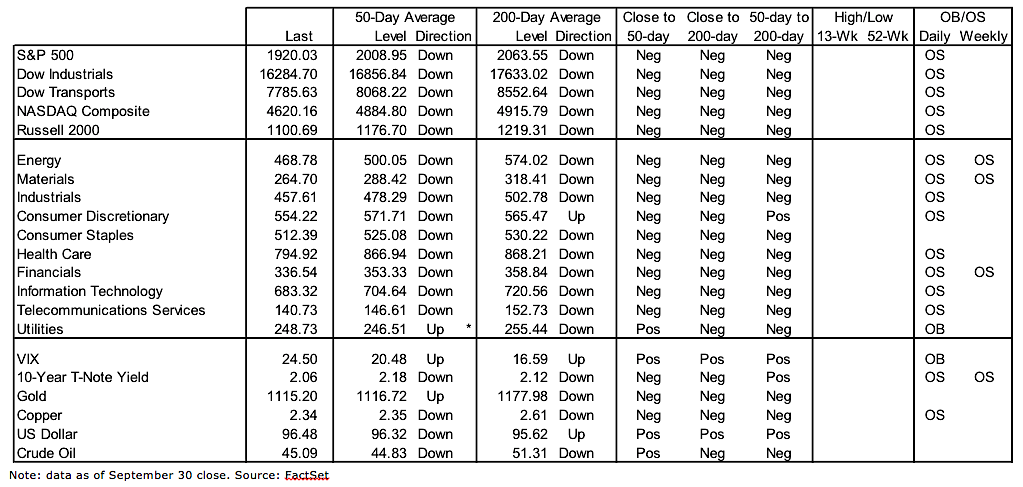
Stock Market Indicators – Indices & Sectors (click to enlarge)
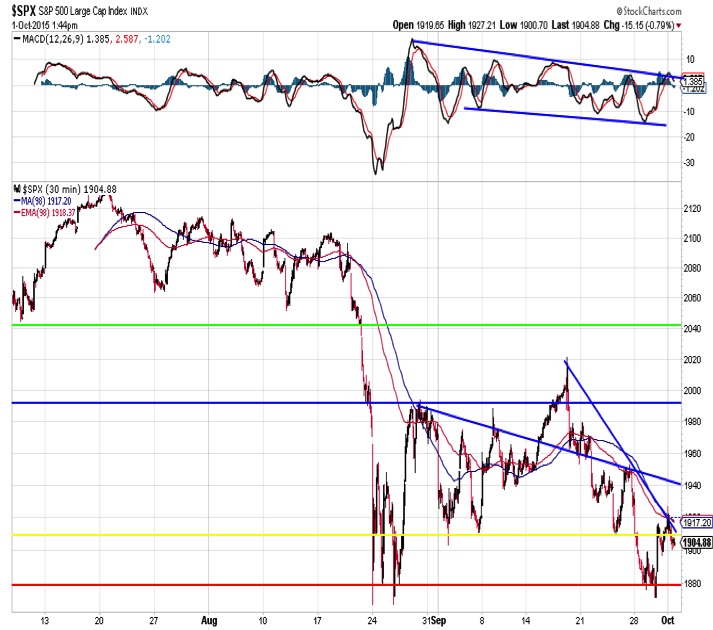
S&P 500 Index
A full re-test of the August lows has emerged on the S&P 500. While support near 1880 has held for now, the rally stopped at resistance near 1920, and momentum continues to trend lower. This seems to suggest another test of 1880 could be forthcoming.
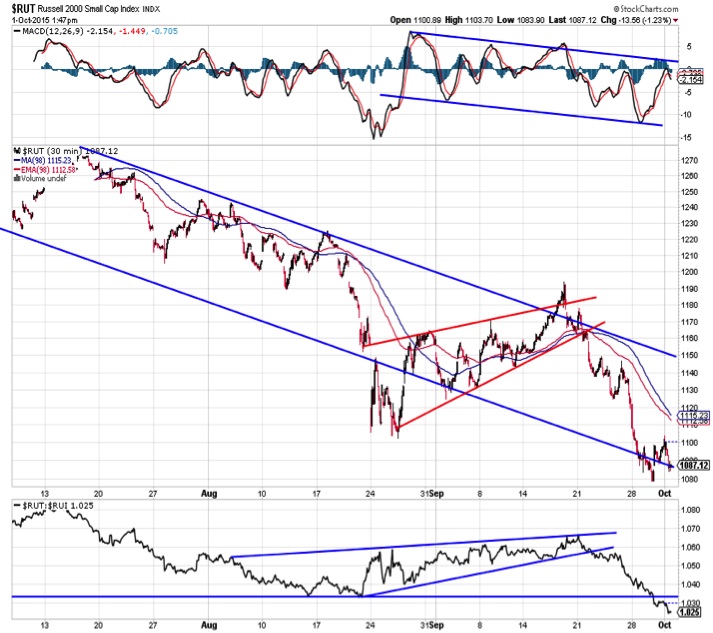
Russell 2000 Index
The short-term trend on the Russell 2000 remains decidedly lower from both a price and momentum perspective. The August lows failed to offer much support, as the index made a lower low this week. Now 1100 looms as a resistance level as the Russell plumbs the lower bounds of its trend channel. The relative gains in small-caps versus large caps that emerged off of the late-August lows have now been completely unwound. We are not seeing small-cap leadership like what was seen a year ago.
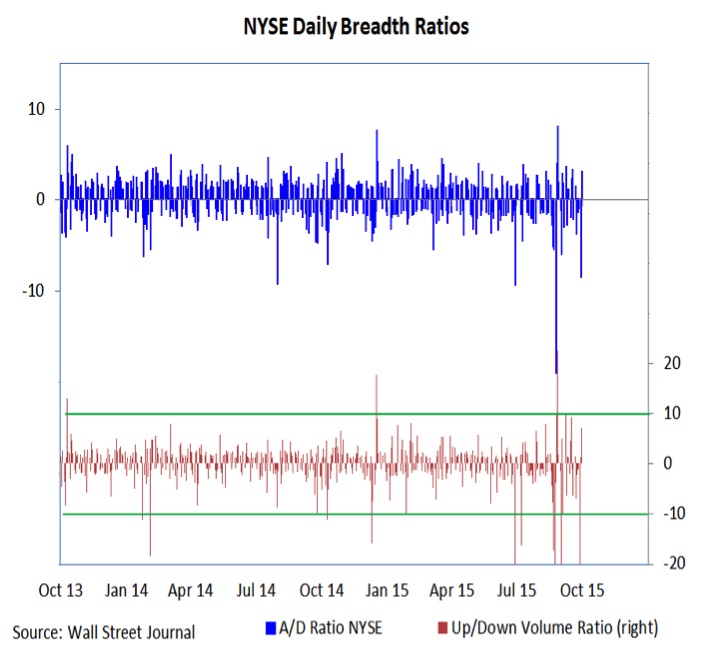
NYSE Market Breadth
Once a good low is in place, we would expect to see a surge in demand for stocks and multiple breadth thrusts. This would not only be represented in higher overall volume, but a significant (10-to-1 or more) tilt toward upside over downside volume. So far, that has not been seen and market breadth continues to lag. Rather, downside momentum seems to still be entrenched, as evidenced by Monday’s 25-to-1 downside to upside volume.
continue reading on the next page…


