The latest stock market correction and swing lower has seen momentum drop to extreme lows (on a intermediate-term basis).
This poses a bit of a conundrum because stocks have been struggling since hitting historic longer-term momentum highs.
So what do investors make of this going forward?
Let’s look at a couple of four-pack charts.
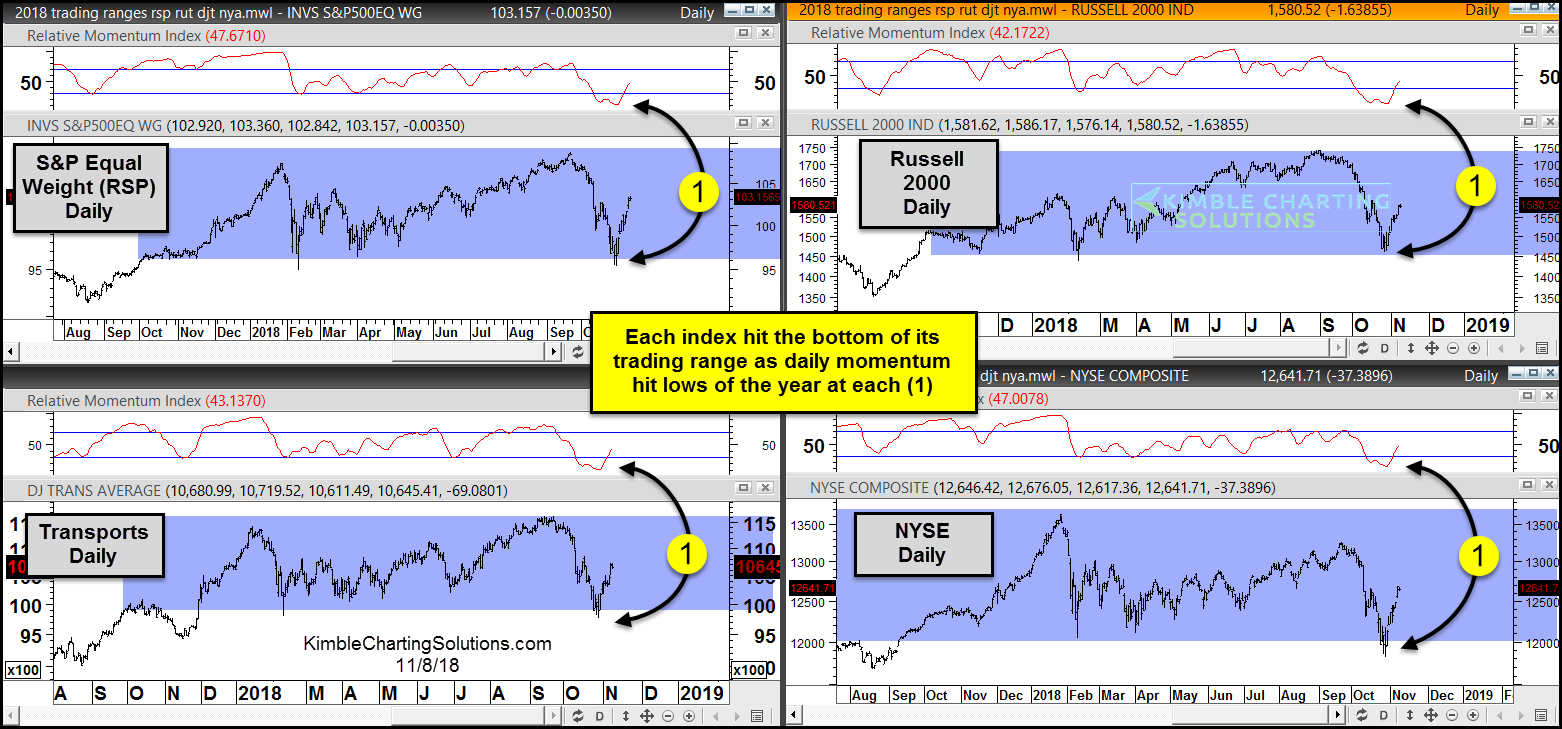
The first 4-pack of charts looks at the “daily” Equal Weight S&P 500, Russell 2000, Dow Transports and NYSE Composite. All of these important stock indexes are in horizontal trading ranges with momentum at the lowest levels in the past couple of years.
This has helped stocks bounce nearly 8 percent off the lows.
Stock Market Index “Ranges” (support at momentum lows)
The next 4-pack of charts is a longer-term look at “monthly” bars for the Equal Weight S&P 500, Russell 2000, Dow Transports and NYSE Composite. In addition to testing the bottom of their trading ranges, the stock indexes are also testing 8-year+ rising support at each (1)… with momentum at/or above 2007 levels.
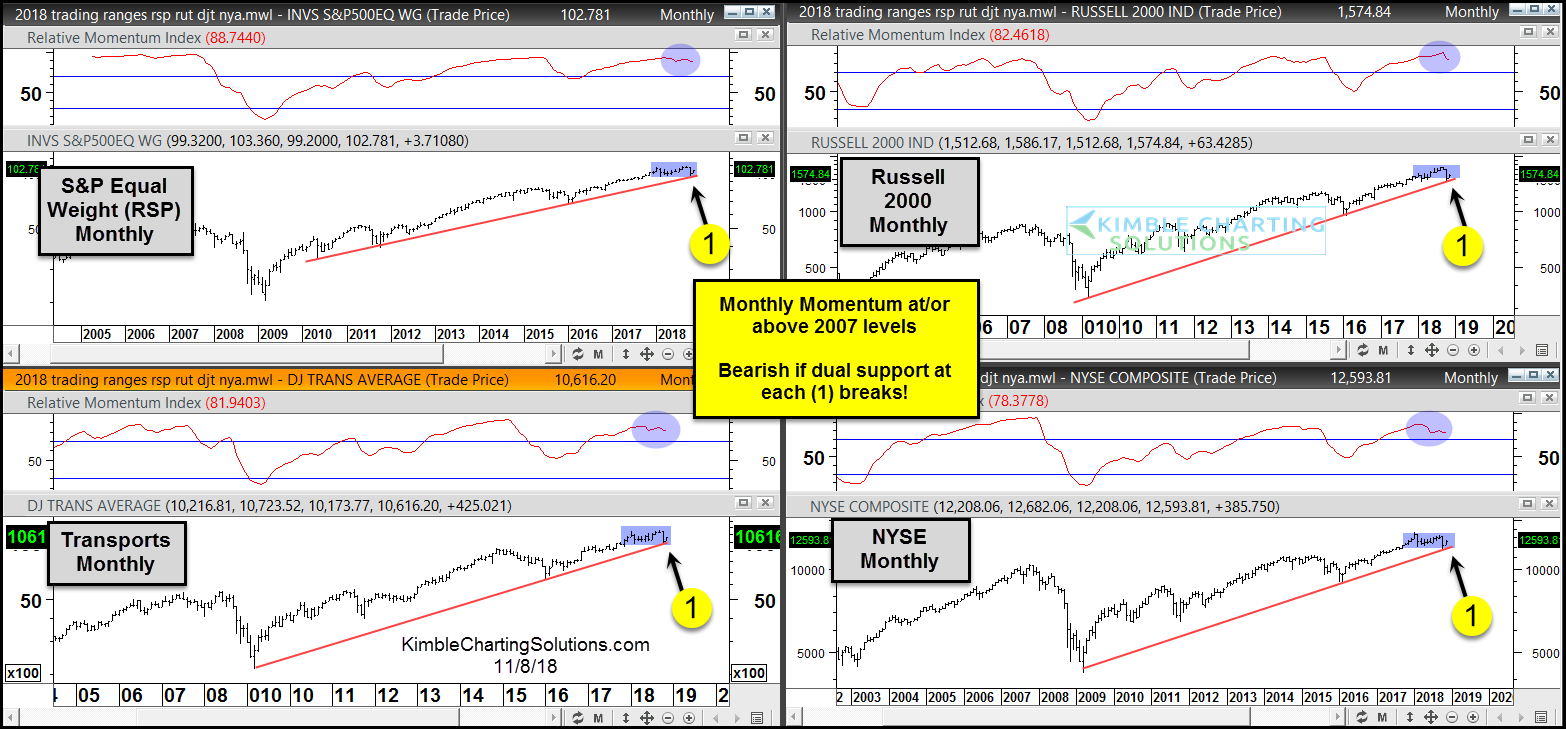
How these two timeframes reconcile will be important for investors.
If support at each (1) would give way, monthly momentum has a long way to go to get oversold. From a big picture perspective, the support test a (1) could be huge!
Note that KimbleCharting is offering a 2 week Free trial to See It Market readers. Just send me an email to services@kimblechartingsolutions.com for details to get set up.
Twitter: @KimbleCharting
Any opinions expressed herein are solely those of the author, and do not in any way represent the views or opinions of any other person or entity.


