 By Joe Acevedo At the contrariancorner.com we have a quantitative model developed by Kevin Ferry that is a trend following model for trading. Trading with the trend is something that breeds trading longevity in this business. But rather than go into what this model is and how great it would be for you to subscribe, I’m going to outline a simple procedure on how you can define a trend and trade pullbacks to that trend. I’m sure this approach in one form or another would cost $50 -$60 in yet another trading book. (We give and give)
Defining the Trend using the ATR
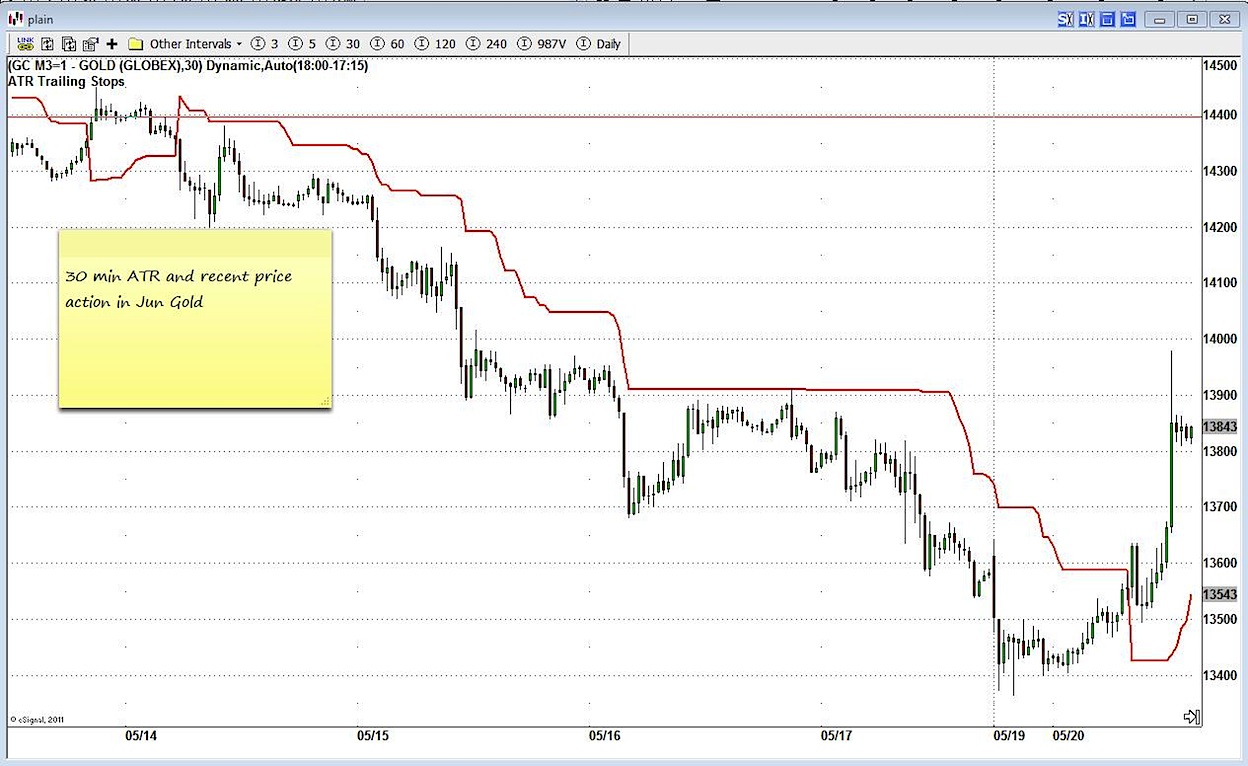
Sylvain Vervoot developed a nifty trend indicator that builds on the indicator developed by Welles Wilder’s ATR (New Concepts in Technical Trading System). Since the ATR measures a security’s volatility, it ensures that the trend stops will compress and expand at the appropriate times. I find it a lot more responsive than many traditional trend measures. Whatever you decide to use, Moving Averages, ATR, Parabolic SAR, etc. just make sure you are consistent with your settings and true to your trading time frame.
I’ve had a lot of discussions with @debrink (Twitter) and he is most expert in using the ATR. His postings and work clearly show the power of staying with the trend. Swing and day traders can achieve good results using the 30 min ATR. Again find a setting that works best with your risk style.
When the 30 min trend flips direction, more often than not it’s a local price extreme and day traders should wait for a bit of a pullback for trade entry.
June Gold 30 min ATR defining trend – Click to enlarge chart
Pullbacks to the trend Symmetry
Symmetry is equality or similarity when comparing price moves in the same direction. It’s a concept I learned from Carolyn Boroden (Fibonacci Trading).
No doubt some are familiar with the concept of a measured move, where some type of stock market pattern is presented and a breakout of that pattern argues for a point move. Symmetry is more concerned with finding pullbacks within the trend to buy or sell with the trend.
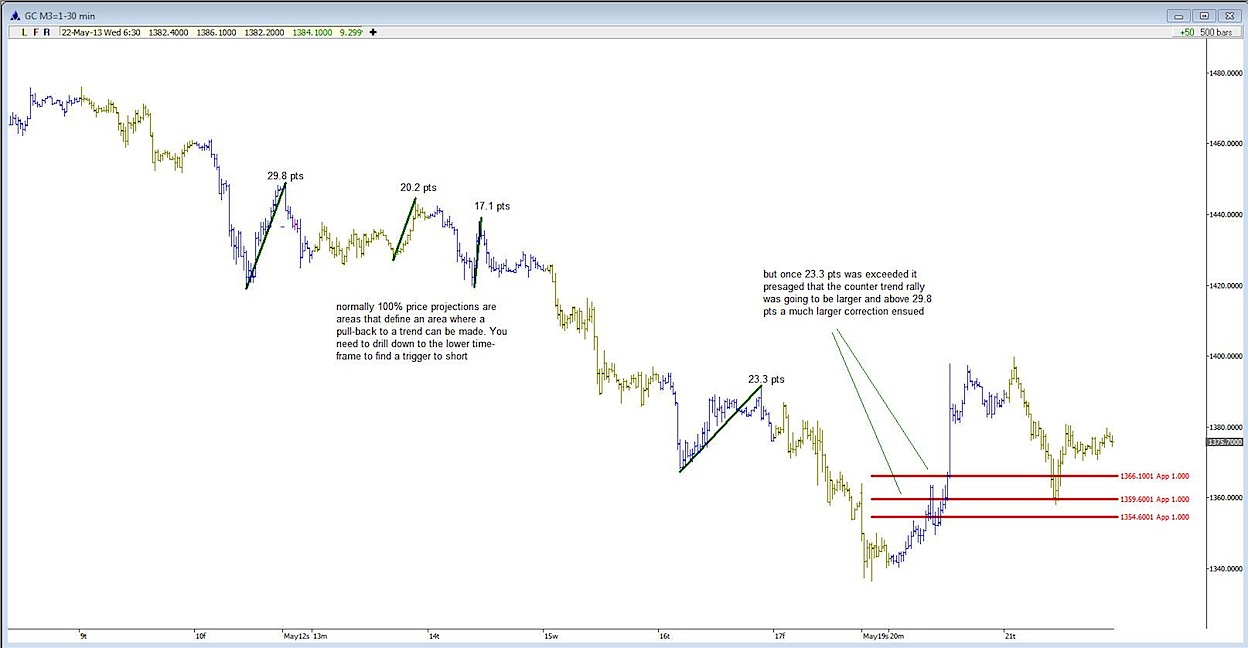
Symmetry finds 100% price projections of previous price moves. It is at these corrective price moves that we want to trade in order to trade with the trend.
Violation or a break of Symmetry tells you that a larger correction is in play. Similar price changes have been exceeded and the market is setting up for a larger degree correction. Important trend changes are most often presaged by a break of symmetry.
Symmetry trade set-ups offer a relatively low-risk trade with defined risk.
June Gold 30 min chart showing symmetry resistance – Click to enlarge chart
Once you have defined your trend via the ATR and pullbacks to the trend using symmetry, you will need a trigger on a smaller time frame: 3 -5 min (would suffice) that would trigger you into a trend trade lower. Hope you found this helpful. Thanks for reading.
Background
About Joe Acevedo: Joe is a private trader of financial futures who abides by the notion of “think macro, trade micro”. Joe has dabbled with all things quantitative from marketing to econometrics in his post graduate & doctoral fellowship studies. Joe spent his career in financial information companies, beginning in the mailroom at Standard & Poor’s to a director at Dow Jones, with an entrepreneurial stint along the way in the UK. After having made close to probably every trading mistake under the sun, he has survived and has now spent the last several years trading professionally. He welcomes your feedback & comments. joe@tradingpoints.net / Twitter: @tradingpoints
No position in any of the mentioned securities at the time of publication.
Any opinions expressed herein are solely those of the author, and do not in any way represent the views or opinions of any other person or entity.


