Stock Market Outlook for January 18, 2018
Bullish undercurrents prevail – grinding upside motion – traders must watch support levels carefully for signs of any breakdown. Resistance breached but the Nasdaq futures lag by not breaking to new highs yesterday as the others did.
Note that you can access today’s economic calendar with a full rundown of releases.
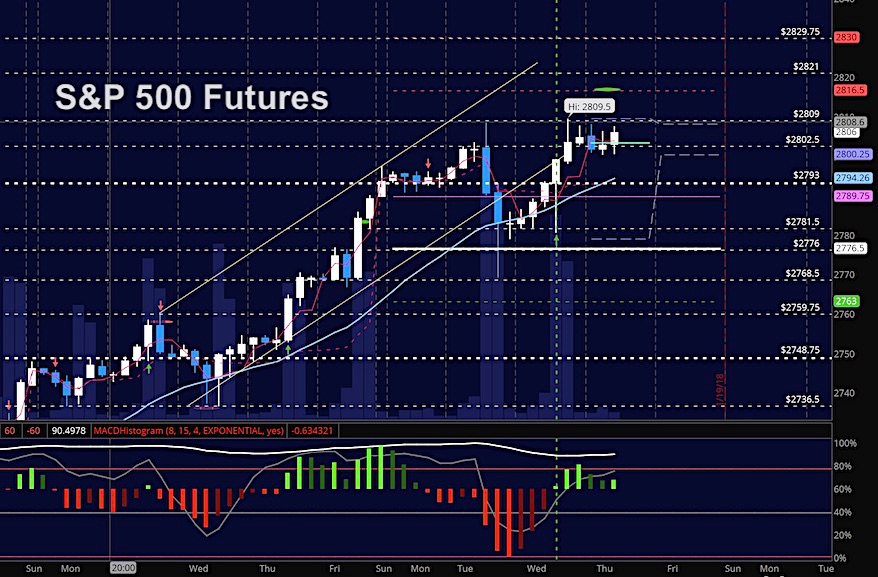
S&P 500 Futures
Resistance is higher at 2809 and support to watch today is 2800. Buybacks remain buying opportunities but as grinding motion begins, we could move into a reversion to the mean play near 2794. The bullets below represent the likely shift of trading momentum at the positive or failed retests at the levels noted.
- Buying pressure intraday will likely strengthen with a positive retest of 2809
- Selling pressure intraday will likely strengthen with a failed retest of 2800
- Resistance sits near 2806.75 to 2809, with 2812.5 and 2816.75 above that
- Support holds between 2800.25 and 2794.5, with 2789.5 and 2776.5 below that
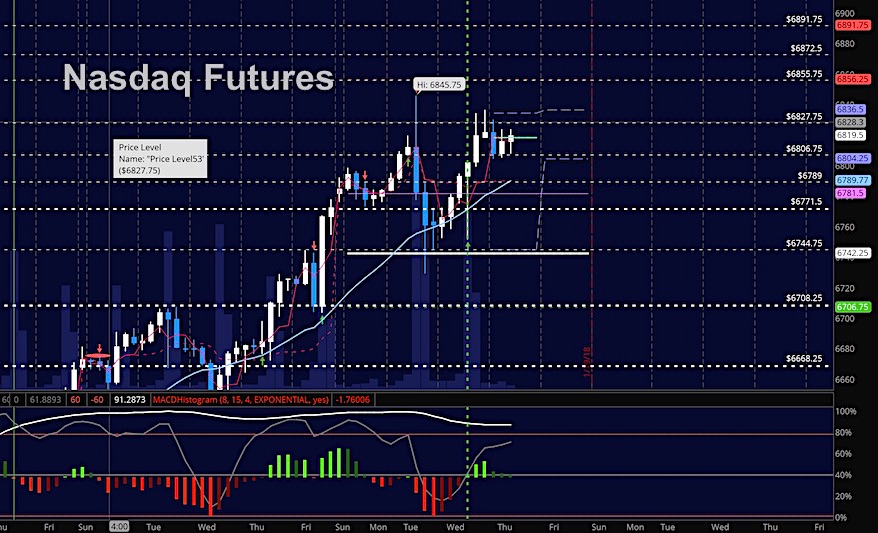
NASDAQ Futures
As mentioned in the live trading room yesterday, I felt that 6827 would give traders trouble to breach and indeed, we have not been able to hold over that region. The level near 6730 will be the break we need to see for buyers to resume control in the chart. We are bullish so breakdowns seem unlikely. As with everything to the upside, we look for support to hold in these spaces as buying pressure will be strongest at support. The bullets below represent the likely shift of intraday trading momentum at the positive or failed tests at the levels noted.
- Buying pressure intraday will likely strengthen with a positive retest of 6830.75
- Selling pressure intraday will likely strengthen with a failed retest of 6800.75
- Resistance sits near 6827.5 to 6836.5 with 6845.5 and 6856.5 above that.
- Support holds near 6806.5 and 6789.75, with 6775.5 and 6742.5 below that.
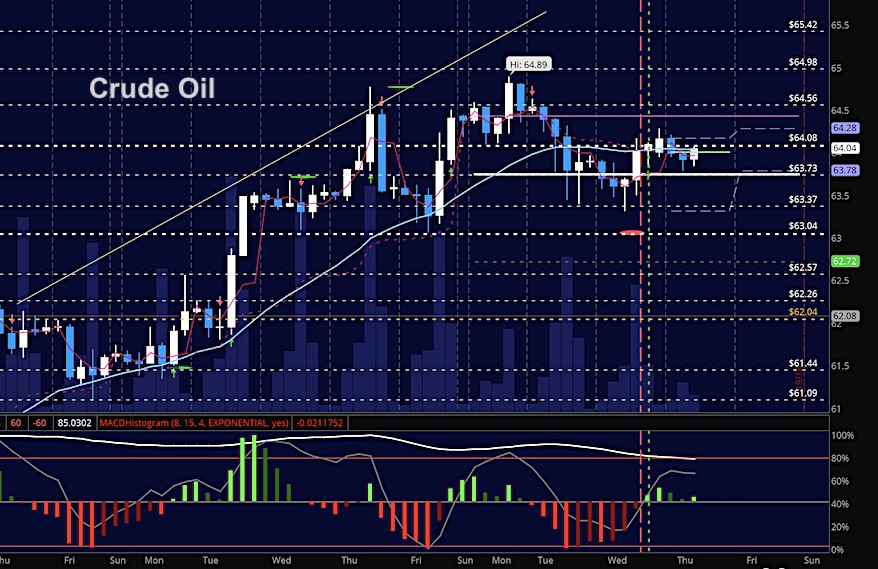
WTI Crude Oil
EIA report at 11am eastern today. Commodities have shifted pressure in what appears to be a reversion to the mean trade on the horizon. We do have contract rolls ahead over the coming days, and we do see an extraordinary amount of bullish weight in the contracts. Watch for support to break as contracts are rolled to the forward month. Support to watch is familiar – 63.7. The bullets below represent the likely shift of trading momentum at the positive or failed tests at the levels noted.
- Buying pressure intraday will likely strengthen with a positive retest of 64.3
- Selling pressure intraday will strengthen with a failed retest of 63.7
- Resistance sits near 64.08 to 64.28, with 64.56 and 65.4 above that.
- Support holds near 63.78 to 63.37, with 63.04 and 62.57 below that.
If you’re interested in the live trading room, it is now primarily stock market futures content, though we do track heavily traded stocks and their likely daily trajectories as well – we begin at 9am with a morning report and likely chart movements along with trade setups for the day.
As long as the trader keeps himself aware of support and resistance levels, risk can be very adequately managed to play in either direction as bottom picking remains a behavior pattern that is developing with value buyers and speculative traders.
Twitter: @AnneMarieTrades
The author trades stock market futures every day and may have a position in mentioned securities at the time of publication. Any opinions expressed herein are solely those of the author, and do not in any way represent the views or opinions of any other person or entity.


